

Most animation studios know whether their projects shipped on time and whether the client was happy. Beyond that, the picture gets blurry. Revenue is coming in, artists are busy, the render farm is humming, but nobody can explain with certainty why margins keep shrinking, or why the same bottlenecks appear on every production.
The strangest part is that the studio is generating data every day, but measuring almost none of it.
This is not a rare situation.
Animation is a creative industry where the instinct is not directly to invest attention in the systems surrounding the craft.
But as studios grow, take on more clients, and manage larger teams, running on intuition becomes expensive: decisions about hiring, pricing, and pipeline design get made on gut feeling when they could be made on evidence.
This article lays out the key performance indicators (KPI) that give animation studios a real operational picture, explains why each one matters, and shows how to start tracking them with our animation production tracker Kitsu without drowning in spreadsheets.
Why KPIs Matter for a Creative Studio
In creative industries, metrics can feel at odds with artistic work. The concern is understandable but misplaced: KPIs do not replace creative judgment.
Consider a studio that is consistently profitable on short-form commercial work but loses money on episodic projects. Without tracking gross profit margin by project type, the studio's leadership might attribute the loss to bad luck or a difficult client rather than a structural pricing problem.
With that data, the fix becomes obvious: KPIs surface problems that are otherwise invisible until they become serious.
Studios that track delivery performance can have honest conversations with clients about scope. Studios that track utilization rates can make smarter decisions about when to hire versus when to bring in freelancers. Studios that track client retention can quantify the cost of a relationship going wrong, which changes how much energy they invest in keeping it right.
The use cases are many, so the first roadblock is to choose what to track.
How to Choose KPIs Without Tracking Everything
It's important to state that a list of forty KPIs is just a distraction. If you have that many, they aren't "key", by definition.
So the first goal is to identify the metrics that are most connected to how your studio actually makes and loses money, or specific parts you wish to improve, then build a simple, consistent system to track them.
A practical starting point is to ask three questions: Where do projects go wrong? Where does money disappear? Where do people burn out? The answers will point to the one metric that deserves your full attention. The rest can be worked on at a later time.
Leading indicators are also better than lagging ones: Revenue per project tells you what happened last quarter, while a pitch-to-win conversion rate tells you what is likely to happen next quarter. Both matter, but the latter gives you time to act.
Project Delivery and Efficiency
First, some metrics to tell you whether your production pipeline is functioning as designed:
- On-time delivery rate measures the percentage of projects or milestones delivered by the agreed deadline. For animation studios, late delivery triggers penalty clauses, damages client relationships, and forces artists into overtime. A studio with a consistent on-time delivery rate below 80% has a structural problem, not a scheduling problem, and the solution requires looking at how projects are scoped and planned, not just pushing harder at the end.
- Average project cycle time tracks the total elapsed time from initial concept to final render delivery. This metric is most useful when broken down by project type. A 30-second commercial and a 10-minute explainer video should have different benchmarks. When cycle times start drifting longer, it is usually a signal that something in the pipeline is absorbing time that nobody has accounted for.
- Revision rounds per project counts how many feedback-and-correction cycles a project goes through before the client accepts it. Two rounds on a commercial project might be expected. Five rounds is a sign that something broke down earlier, either in the brief, in the creative direction, or in the client approval process. Studios that track this metric often discover that a small number of clients or project types are responsible for a disproportionate share of revision volume.
- Pipeline bottleneck frequency identifies which stages of production most often hold up the rest of the work. Rendering and client review are the most common culprits. If the render farm is the bottleneck on every project, it's an infrastructure investment decision. If client review is the bottleneck, it's a process design problem.
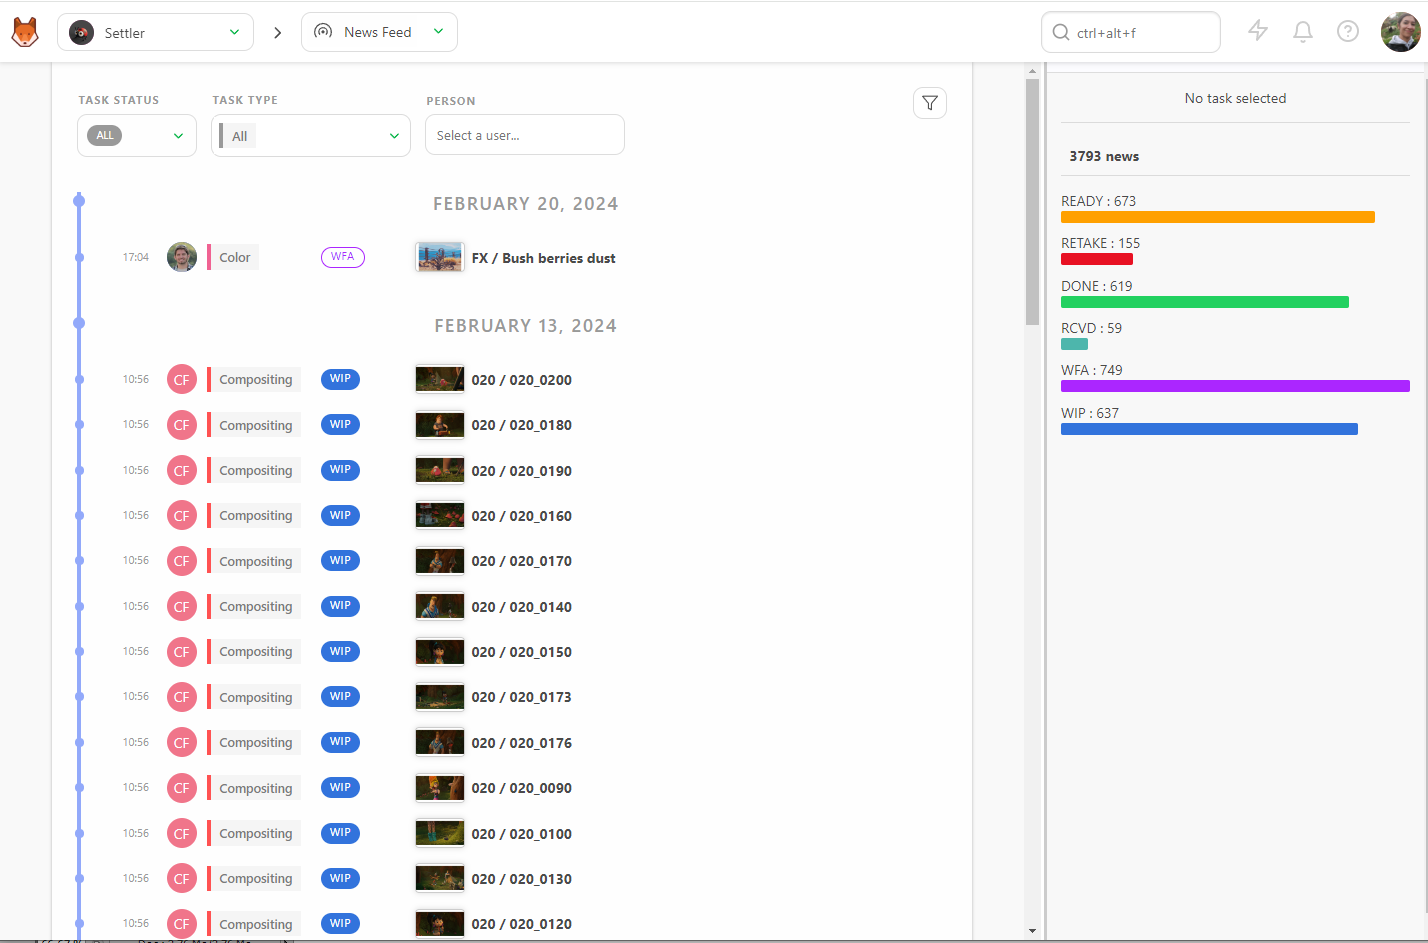
If you use Kitsu as your production tracker, you can use the scheduling features to set milestones and track task-level progress, while the production reports give a high-level and granular view of where things stand. On-time delivery rate and cycle time become visible through the gap between scheduled due dates and actual completion dates on each task. Statuses with a "retake" value are tracked explicitly, so the platform records every back-and-forth cycle on a task to give you a direct count of revision rounds per project. For bottleneck frequency, Kitsu's news feed shows real-time status changes across every stage, making it straightforward to see which task types are consistently in a waiting or blocked state.
Financial Performance
Financial KPIs connect production activity to business health:
- Revenue per project and per client provides the most basic unit economics. It becomes more useful over time, when you can compare it across project types, client categories, and years. A client who generates significant revenue but requires twice as many revision rounds and three times as many communication hours as comparable clients may not be as valuable as the top-line number suggests.
- Gross profit margin by project type is one of the highest-value metrics a studio can track. It requires allocating costs accurately to each project, which takes some setup, but the payoff is significant to prioritize projects and inform pricing and pitch strategy.
- Budget variance is the difference between the estimated cost to complete a project and the actual cost. Studios that consistently underestimate budgets are either pricing incorrectly or scoping inaccurately. Tracking variance per project, and averaging it over time, reveals whether estimation is a systematic problem or an occasional one.
- Utilization rate measures billable hours as a percentage of total available hours. An artist who works 40 hours a week but bills only 25 of them has a utilization rate of 62.5%. Industry benchmarks vary, but most studios aim for 70% to 80% for creative staff. Rates below that suggest inefficient scheduling or too much administrative burden on artists. Rates above 85% sustained over time are a burnout risk.
- Days Sales Outstanding (DSO) measures how long it takes to collect payment after invoicing. In animation, late payment is endemic. Clients regularly pay 60 or 90 days after delivery on contracts that specify 30. A rising DSO is a cash flow problem before it becomes a crisis. Studios that track it can intervene earlier, whether by tightening contract terms, adding late payment clauses, or simply following up sooner.
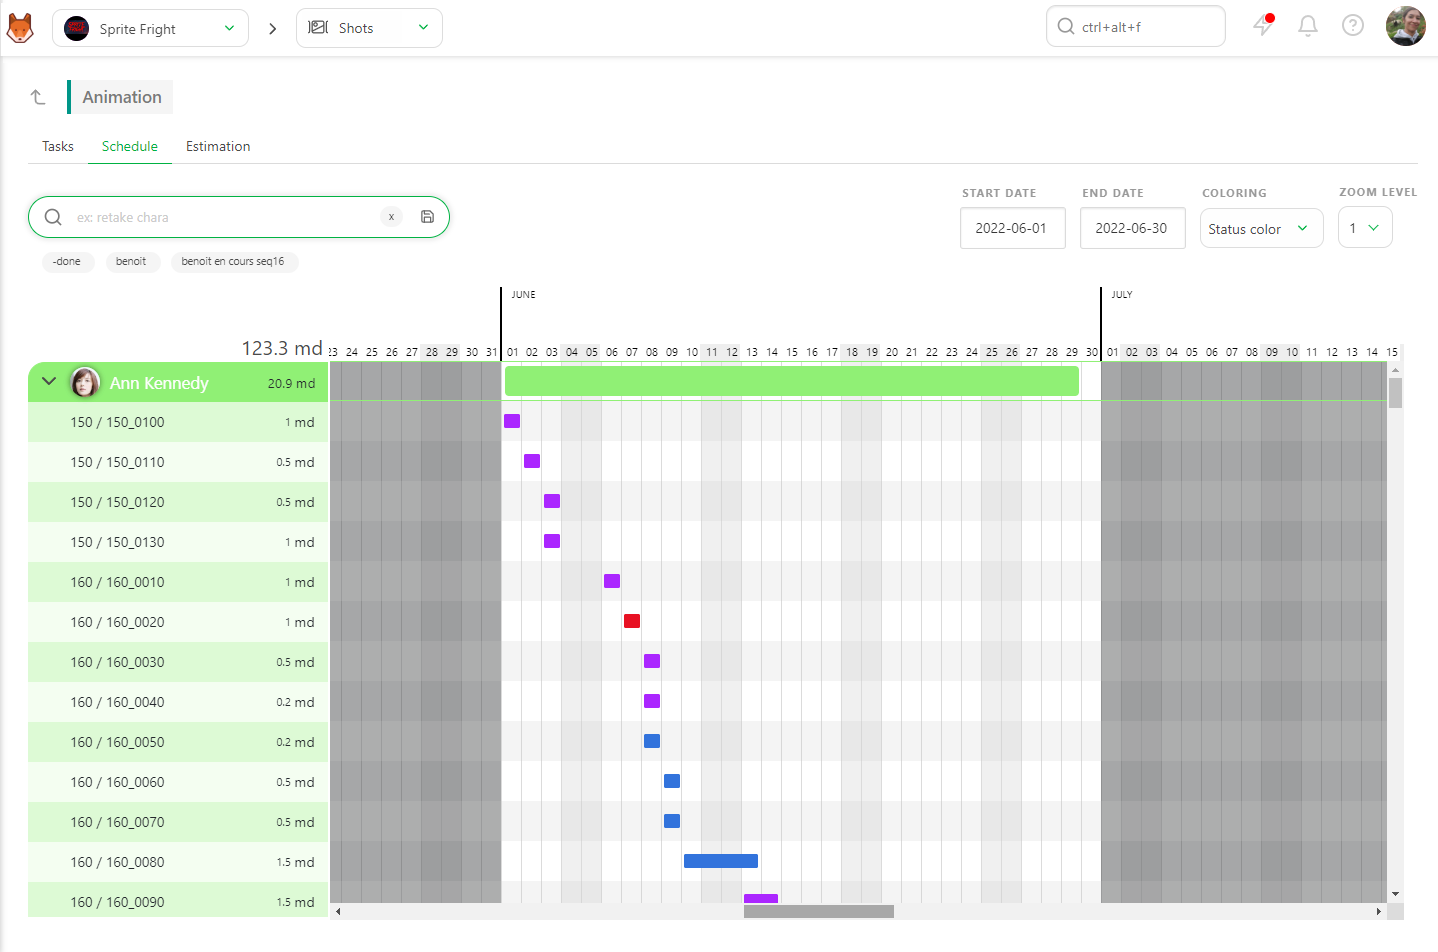
On the task type page in Kitsu, you can compare your original estimates against artists' actual logged time, and compare estimated start/end dates against the actual WIP and validation dates: the foundation for calculating budget variance. The estimates can also be combined with rate cards to calculate utilization and gross margin per project type. The budget feature allows you to forecast HR and licensing costs. Kitsu's timesheet data can be exported as a CSV file and opened in spreadsheet software for further analysis.
Team Productivity
Productivity metrics in animation require care to identify systemic inefficiencies, not to put pressure on individual artists:
- Frames or seconds of animation completed per artist per week provides a baseline measure of output. It is most useful at the department or project level, where it can reveal whether certain production approaches consistently yield more throughput than others. A junior animator working on a complex character rig will naturally produce fewer frames than a senior animator on a simpler asset. Context matters.
- Asset production throughput tracks how quickly rigs, backgrounds, and VFX elements move from assignment to completion. Delays here have downstream effects on animation, which cannot proceed until assets are ready. Studios that track this metric often find that a small number of complex assets cause most of the delay.
- Render farm utilization rate measures how much of the render infrastructure's total capacity is being used. Both extremes are problems. A utilization rate consistently below 50% means the studio is paying for capacity it does not need. A rate above 90% means jobs are queuing, slowing delivery, and creating pressure on deadlines.
- Rework and correction rate measures the proportion of completed work that has to be redone because of errors rather than client-requested changes. This distinction matters. Client revisions are a normal part of creative work. Internal corrections caused by miscommunication, technical errors, or unclear briefs are a cost that should be minimized. A rising rework rate by department indicates a training or briefing problem.
- Overtime hours per department is a leading indicator worth watching closely. Sustained overtime predicts burnout, which predicts turnover, which is expensive. It also frequently predicts missed deadlines on future projects, because fatigued teams make more errors and take longer to recover between projects. If one department is consistently working overtime while others are not, the bottleneck is likely there.
- If the studio develops original IP, tracking development slate progress and IP licensing revenue as separate metrics makes sense. These projects operate on fundamentally different timelines and economics than client work, and conflating them obscures both.
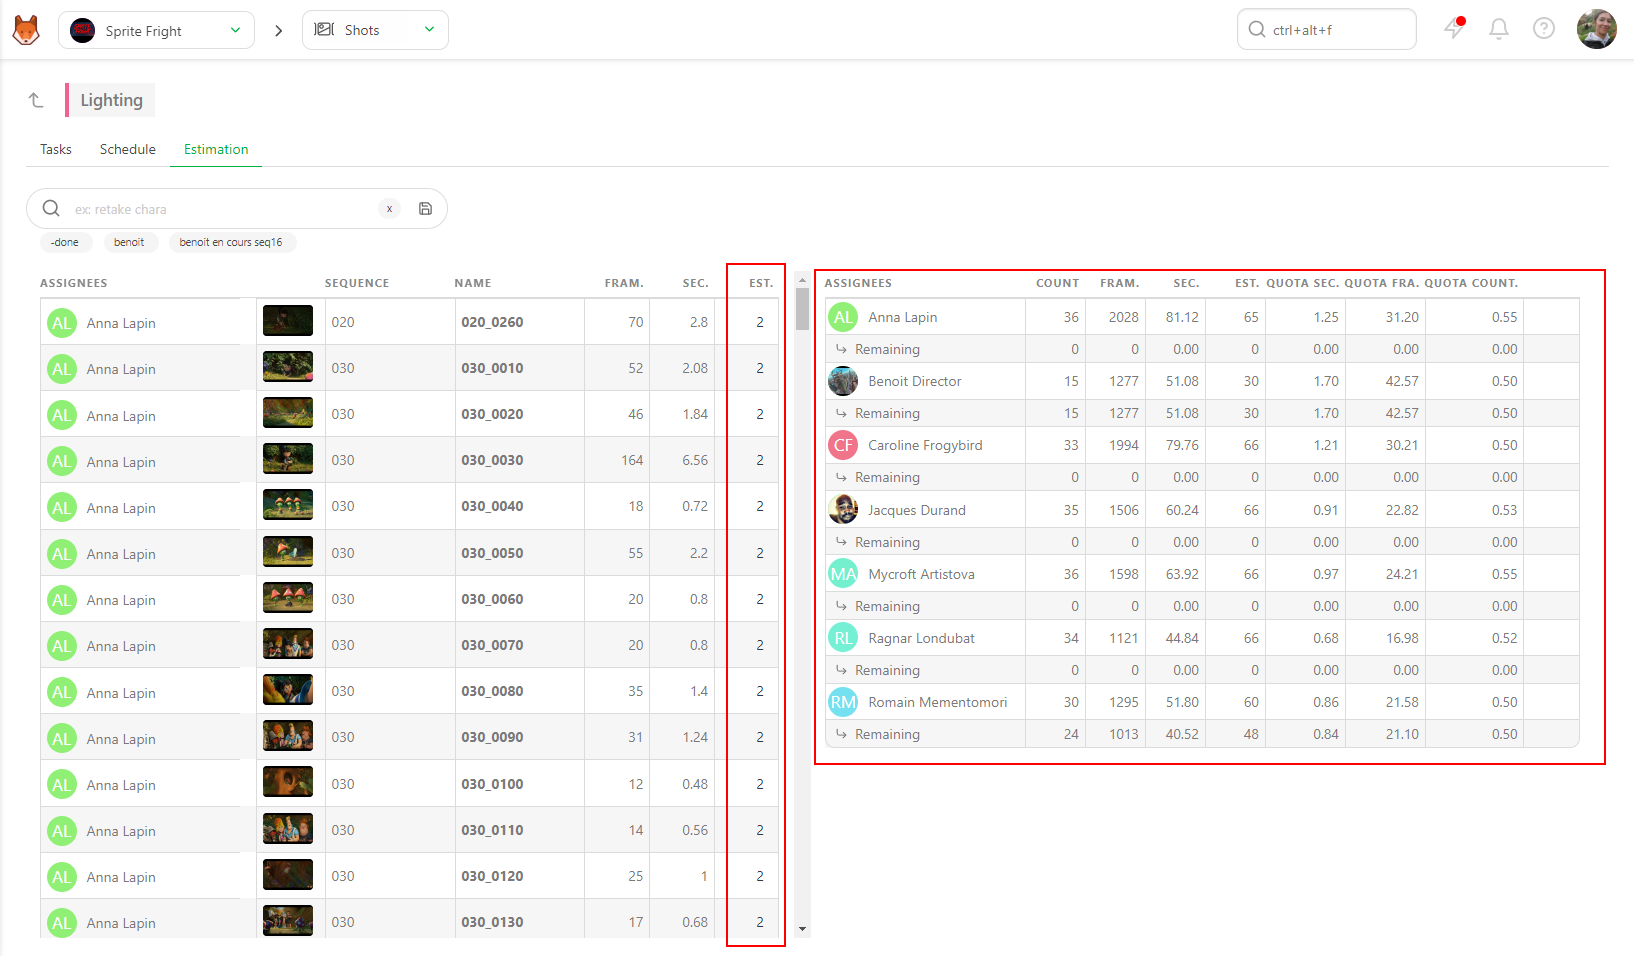
This is where Kitsu is most directly useful. Kitsu calculates quota metrics like frames, seconds, or tasks completed per day, week, or month per artist, using either timesheet entries or status changes, depending on what the studio logs. Asset throughput is visible through task start and due dates on each asset type. A schedule view with a timesheet overlay lets you compare time spent against estimates at a glance, making it easy to spot departments where actual hours are running ahead of plan. Render farm utilization is not tracked natively inside Kitsu but can be piped in via the API. Rework is surfaced through the retake status count, which distinguishes internal corrections from client-driven revision rounds.
Client and Business Health
Client metrics tell you whether the relationships sustaining the studio are stable or eroding, and whether the pipeline of new work is healthy.
- Client retention rate measures what percentage of clients return for a second or subsequent project within a defined period. For studios that work on long productions, annual retention rates may not be as meaningful as project-to-project retention. High retention reduces business development costs and stabilizes revenue. A declining retention rate is an early warning sign even when current revenue looks healthy.
- Client satisfaction score (CSAT or NPS) collects direct feedback from clients about their experience. The specific score matters less than the trend and the qualitative feedback attached to it. Studios that survey clients after delivery often surface recurring complaints that never made it into official feedback, like slow responses during review stages or inconsistent communication between team members.
- Pitch-to-win conversion rate tracks how many submitted proposals result in signed contracts. A low conversion rate is not always a problem. Studios that pitch selectively may have a low rate but win high-value work. A conversion rate that is declining, however, suggests that something is changing, whether in pricing, in how proposals are positioned, or in the competitive landscape.
- Repeat business percentage measures what share of total revenue comes from existing clients versus new ones. Neither extreme is ideal. A studio that generates 90% of revenue from one returning client has a concentration risk. A studio generating almost no repeat business may have a client satisfaction problem or a positioning problem.
- New client acquisition rate and proposal volume belong in a business development section alongside retention metrics. Retention tells you how well you keep clients. Acquisition tells you whether the funnel is healthy. Both matter, and tracking only one gives an incomplete picture.
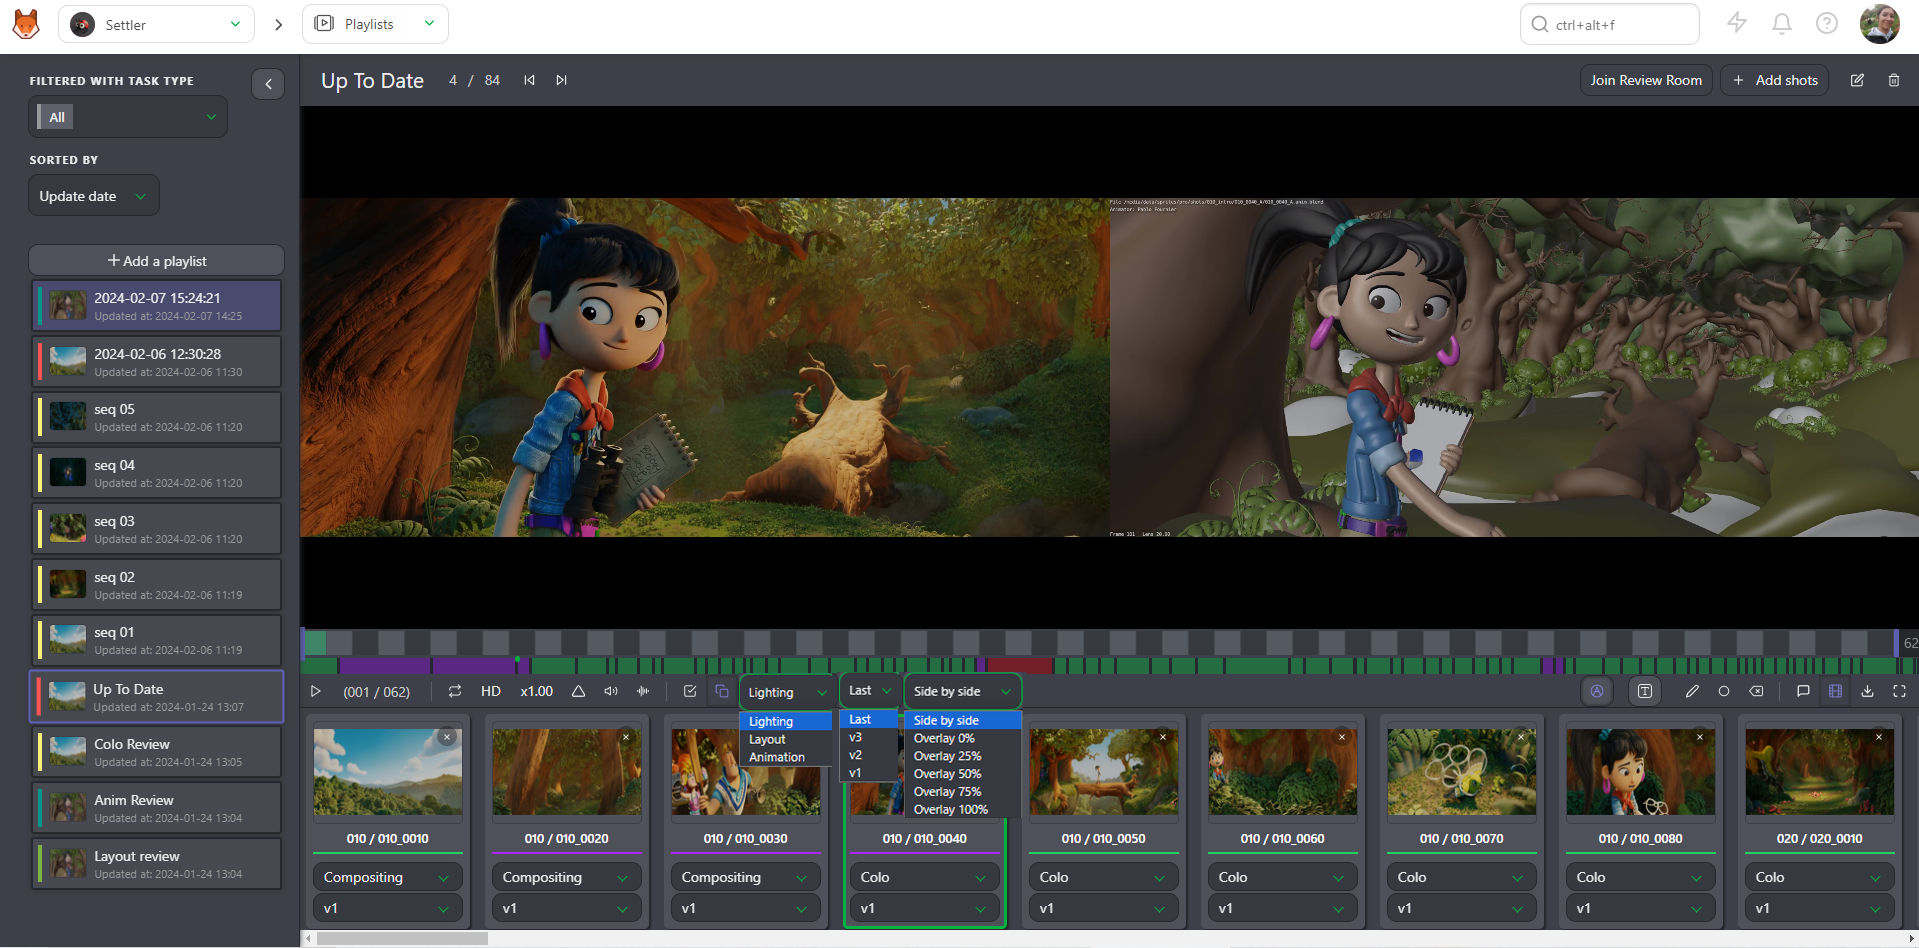
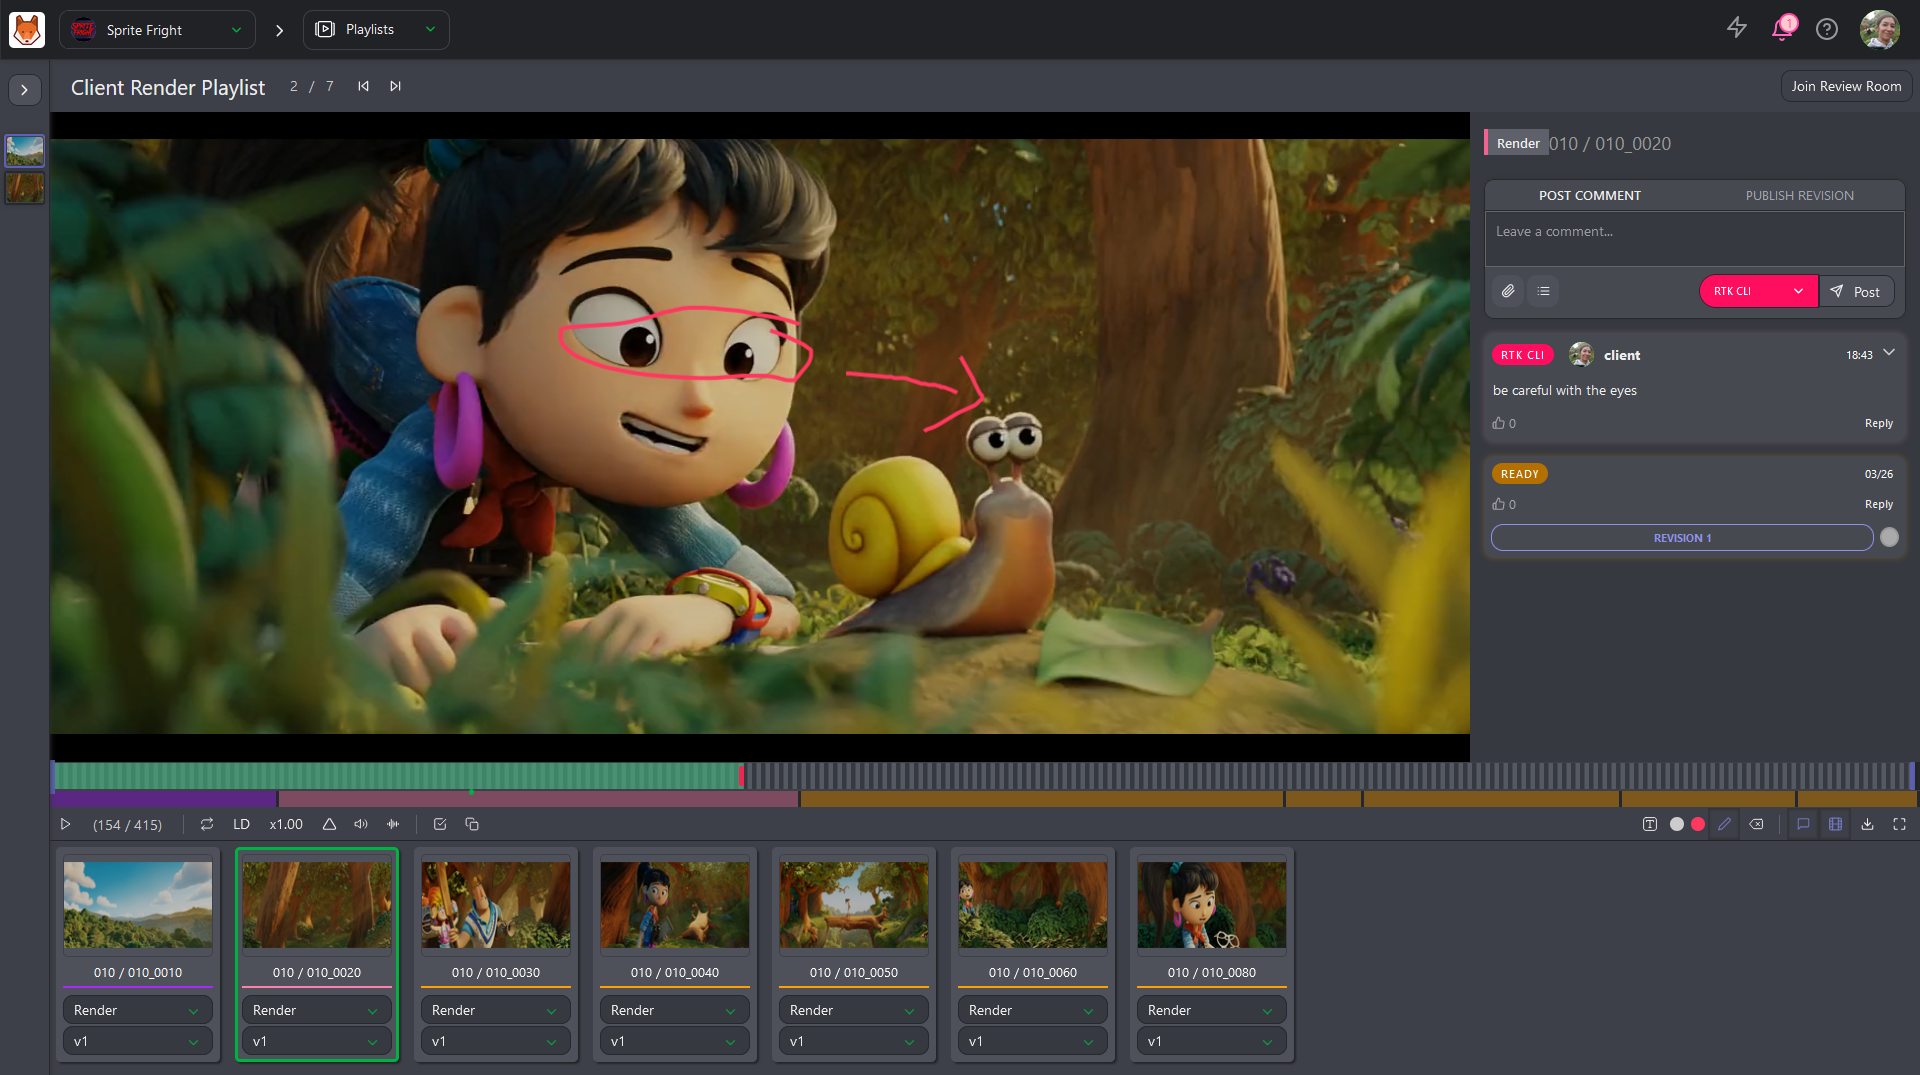
Kitsu's contribution here is indirect but real: review playlists let you share work with clients in a managed environment, and clients can leave frame-level feedback directly in the platform to create a structured record of every client interaction during a production. This gives production managers real-time visibility into where clients are in the review process, reducing the communication delays that tend to erode satisfaction scores.
Quality Control
Quality metrics distinguish between errors caught internally and errors that reach the client.
- Defect and error rate at final delivery counts the number of technical or creative errors identified at the delivery stage. Zero is the goal, but more important than the number itself is whether it is trending up or down. A rising error rate at delivery often indicates that QA is being compressed to meet deadlines.
- Client-requested revisions post-delivery tracks changes requested after the client has formally accepted a deliverable. These are distinct from revision rounds during production. Post-delivery revisions are disruptive, often unbillable, and a sign that the acceptance review was not thorough enough on one or both sides.
- Internal QA pass rate on first submission measures how often work submitted to the QA stage passes without requiring corrections. A low first-pass rate means QA is catching problems, which is the point of having QA, but it also means more time and cost per project. The goal is to raise the standard earlier in the pipeline so QA becomes a final check rather than a second round of corrections.
- Delivery acceptance rate on first client submission is distinct from internal QA. It measures whether the client accepts the deliverable the first time they see it. A studio that consistently fails this benchmark may have a brief problem, a communication problem, or a quality control problem. Distinguishing which one requires looking at the accompanying feedback.
Kitsu's status system distinguishes between internal retakes and client feedback, and the "retake" flag on a status type enables tracking of back-and-forth cycles at the task level. Internal QA pass rate on first submission and delivery acceptance rate on first client submission can both be derived from the ratio of tasks that moved straight to a "done" or "approved" status versus those that accumulated retake flags before validation. Clients can now attach frame-level comments to shared playlists, making post-delivery feedback easier to log and distinguish from in-production revision rounds. The full version history of every task is preserved, so QA trends can be reviewed over time and across productions.
Talent and HR
People are the studio's most significant cost and most significant asset. HR metrics protect both.
- Employee retention and turnover rate is the most important HR metric for most studios. Losing an experienced animator or technical director is expensive in ways that rarely show up on a single invoice: knowledge walking out the door, recruiting costs, onboarding time, and the disruption to ongoing projects. Studios that track turnover by department can identify where the problem is concentrated and address it before it cascades.
- Time-to-hire for specialized roles matters in an industry where some skills like character rigging or pipeline development are scarce. A studio that needs six months to fill a technical director role has a bottleneck that will affect project planning. Tracking this metric creates pressure to build a talent pipeline before it is urgently needed.
- Training hours per employee measures investment in skill development. In animation, tools and techniques evolve quickly. A studio where artists are not regularly learning new software or workflows will gradually fall behind technically. Training hours are a proxy for that investment, though the quality of the training matters as much as the quantity.
- Freelancer-to-staff cost ratio tracks the proportion of labor costs attributed to contractors versus full-time employees. Most studios use a mix of both, and the optimal ratio depends on how predictable and stable the workload is. Tracking this over time reveals whether the studio is becoming more or less dependent on freelance labor, and whether that shift is intentional.
- Contractor onboarding time to full productivity is particularly relevant for studios that scale headcount up and down across projects. If a freelancer takes three weeks to become fully productive on a six-week project, the effective value of that hire is significantly lower than it appears. Studios that invest in onboarding documentation and standard tooling recover this time quickly.
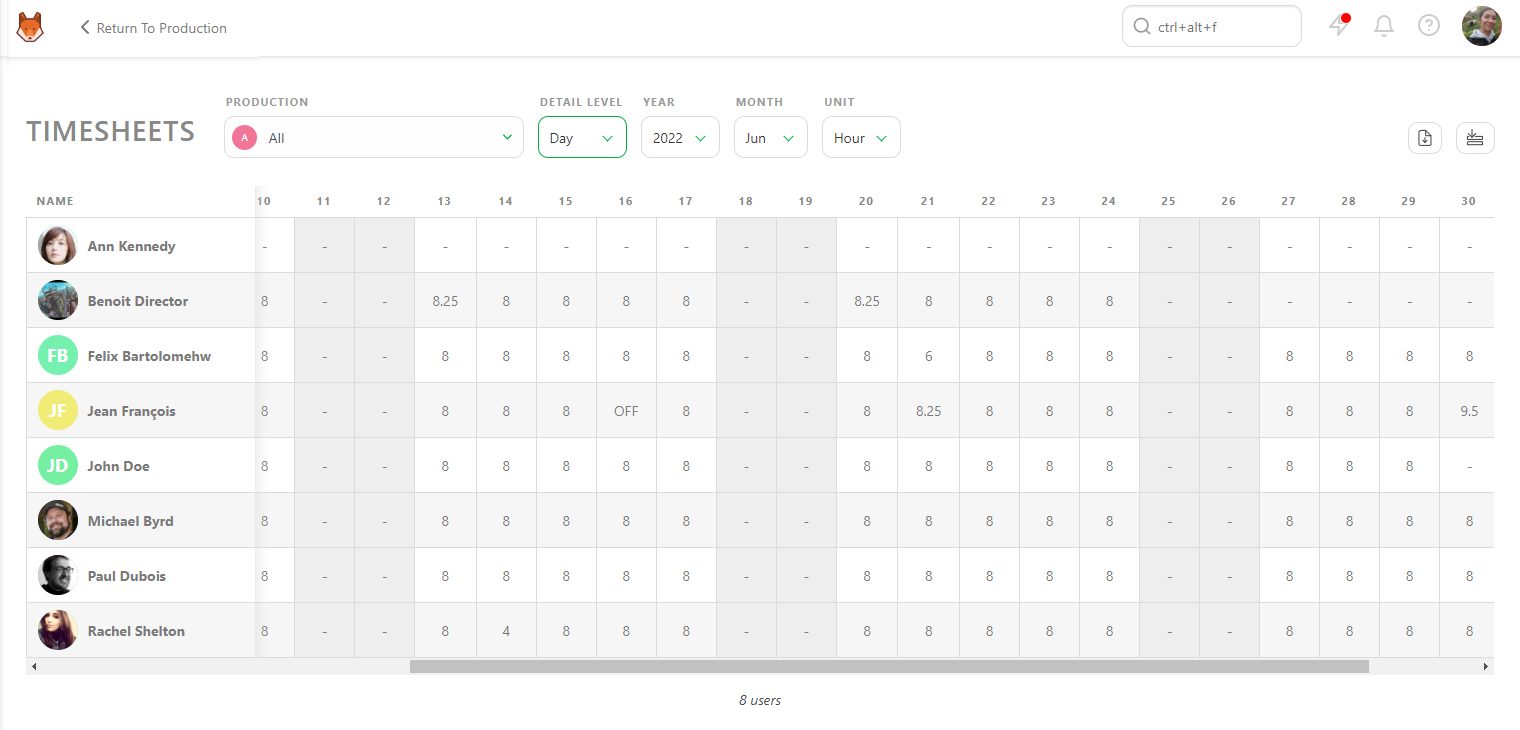
Kitsu tracks time spent per artist and task, which makes it possible to spot sustained overload in specific departments. For freelancer management, Kitsu supports timesheet logging for all team members, including contractors, which gives you the raw data to calculate freelancer-to-staff hour ratios across productions. Contractor onboarding time can be measured informally through the gap between a team member's first task assignment and when their output rate reaches the studio average, both visible in Kitsu's quota reports.
Technology and Infrastructure
Infrastructure metrics are often overlooked, but tracking them proactively prevents outages during production.
- Render time per frame or scene is the most direct measure of technical pipeline efficiency. As projects grow in complexity and scene count, render times expand dramatically. Tracking this metric over time reveals whether infrastructure investment is keeping pace with production demands, and helps justify hardware or cloud rendering decisions with concrete data.
- Software and tool downtime incidents records how often production is interrupted by technical failures. A single catastrophic outage is memorable. Frequent minor outages are often untracked, but their cumulative cost in lost hours can be significant. Logging incidents systematically makes the case for infrastructure investment and helps identify patterns in what breaks and when.
- Storage utilization and data management costs tend to grow quickly in animation production. Raw footage, project files, and render outputs accumulate fast. Studios that do not track storage growth often face unexpected costs or scramble to archive projects during active productions. A proactive storage management policy starts with knowing how much you are using and how quickly that number is increasing.
- Pipeline automation adoption rate measures how consistently the team is using automated tools and scripts rather than manual workarounds. Low adoption often indicates that tools are poorly documented, unreliable, or not well matched to actual workflow. High adoption indicates that the pipeline is serving the artists rather than working against them.
- Version control and file naming compliance rate is a metric that most studios do not track but should. Messy file organization is one of the most persistent, underestimated sources of lost time in animation production. When artists spend 20 minutes locating the correct version of a file, or when renders are submitted from the wrong asset version, the cost accumulates invisibly. A compliance rate gives the studio a concrete target and a way to hold the pipeline accountable.
- On the sustainability side, tracking cloud versus on-premise render costs and energy usage is increasingly relevant. Cloud rendering offers flexibility but can generate unpredictable costs. Studios with a clear view of these numbers make better decisions about when to spin up cloud resources and when to run jobs locally.
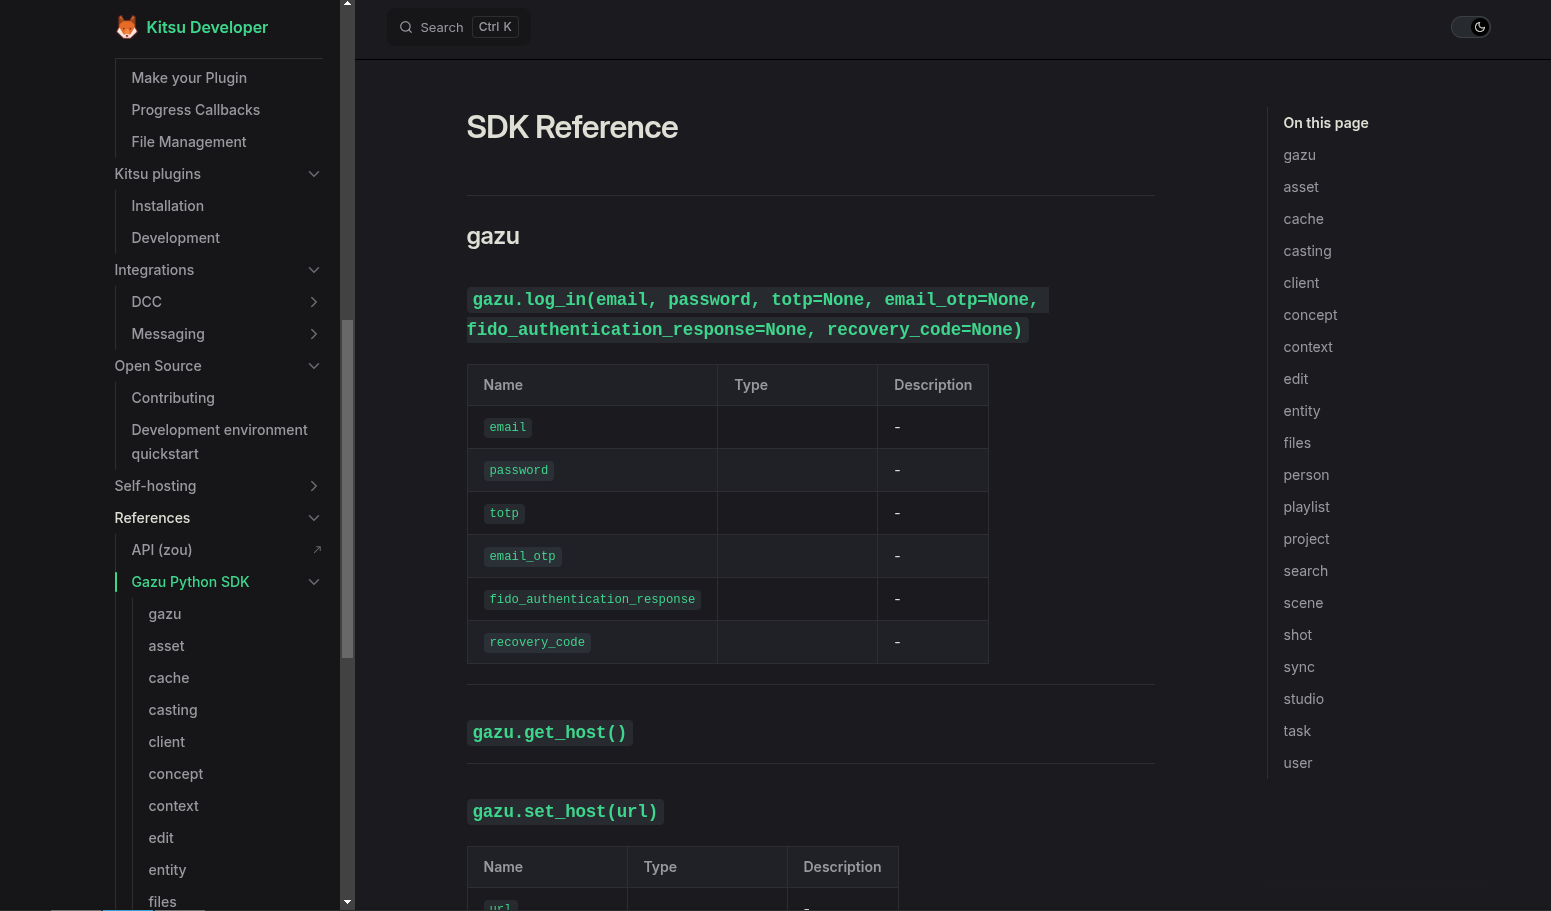
Kitsu's studio database exposes production data through a Python SDK (Gazu) and a HTTP API, making it straightforward to build automation scripts and custom pipeline integrations to track how consistently those scripts are used to measure automation adoption rate. For version control compliance, Kitsu provides asset version management natively, storing every preview submission against the correct task and entity. Studios that route all publishes through Kitsu get file naming and versioning compliance almost by default, because the platform enforces structure that a shared drive does not. Kitsu Cloud also offers carbon reporting as a feature, from which you can assess electricity usage and overall infrastructure performance.
Conclusion
The studios that grow sustainably are not necessarily the ones with the most talented artists or the highest-profile clients, but the ones that understand their own operations well enough to make good decisions consistently.
The KPIs covered in this article aren't an exhaustive list and do not all need to be implemented at once. A more realistic approach is to start with the categories where your studio feels the most uncertainty, build a simple tracking system for three metrics top, and review them on a regular cadence. Once those become routine, you add the next layer of analytics.
The goal is not to measure for measuring's sake: it's replacing guesswork with information when decisions matter. When a client asks for a budget reduction, you should know whether you have room. When an artist is struggling, you should be able to tell whether it is a skill gap or a workload problem. When a project type consistently underperforms, you should be able to see it in the data before it does damage.
Animation is a complex business, and the studios that treat it like one are still making work ten years from now. Kitsu helped hundreds of studios with that, hours from signing up.