
Data analytics is often overlooked by animation studios. As the animation industry continues to evolve in a digital age, understanding the importance of data analytics becomes increasingly crucial for studios aiming to stay competitive and deliver captivating content to audiences worldwide: behind the scenes lies a treasure trove of production data waiting to be mined for valuable insights.
This article delves into the significance of data analytics in animation production, shedding light on why its potential is often overlooked and why it should be embraced as a vital tool for success. From performance tracking and cost optimization to audience insights and predictive analytics, the benefits of leveraging production data are deep and far-reaching.
Why Data Analytics for Management:
The incorporation of data analytics in animation studio management is a strategic move driven by the need for precision and efficiency. The intricate nature of data collected by production trackers offers a wealth of insights that, when harnessed effectively, can empower studios to make informed decisions, identify cost-saving opportunities, and maximize revenue.
Animation studios deal with a multitude of data points, ranging from project timelines to resource allocation and rendering processes. The sheer complexity of this data necessitates advanced analytics tools to derive meaningful patterns and trends.
By leveraging analytics, studios can gain a comprehensive understanding of their production processes, enabling them to optimize workflows, minimize bottlenecks, and enhance overall project management.
The traditional approach of relying solely on artistic intuition is gradually being replaced by data-driven decision-making, offering a more strategic and efficient path to success. This transition from a subjective decision-making process to an objective, data-driven approach not only improves operational efficiency but also positions studios to thrive in an increasingly competitive industry.
1. What Data to Measure and How
Animation studios must first identify key metrics to measure.
Time Management
- Task duration for time estimates - Understanding the time required for each task and sprint is essential for accurate project planning. Data analytics can provide valuable insights into the historical performance of animation teams, allowing studios to set realistic deadlines and allocate resources optimally. By analyzing past project data, studios can identify patterns in task completion times, helping them make more informed decisions on project timelines and resource allocation.
- Rendering time - Rendering is a resource-intensive process in animation production, often requiring substantial computing power. Data analytics can streamline rendering processes by analyzing rendering times, identifying inefficiencies, and optimizing the allocation of rendering resources. This not only reduces production costs but also enhances overall project efficiency, allowing studios to deliver high-quality animations within tighter deadlines.
Budget
- Budget and cost data - Monitor budget allocations and actual expenditures for each project. Analyzing cost data helps studios identify areas where expenses can be optimized, leading to better financial management.
Workload distribution
- Resource utilization - Track the utilization of human resources, including artists, animators, and other team members. This can help in identifying underutilized or overburdened resources, allowing for more balanced workloads.
- Task dependencies - Understand the dependencies between different tasks in the production pipeline. Identifying task dependencies helps in planning and prioritizing activities to avoid bottlenecks and delays. In the same vein, knowing when assets are ready for a given shot is pretty useful.
Quality
- Quality metrics - Measure and track the quality of the animation output. This can include client satisfaction scores, feedback from stakeholders, and adherence to quality standards. Monitoring quality metrics ensures that the final product meets or exceeds expectations.
- Error rates - Keep track of errors or rework required during the production process. High error rates may indicate areas that need process improvement, additional training, or better tools.
Productivity
- Workflow efficiency - Evaluate the efficiency of the overall workflow, from project initiation to completion. Identify areas where processes can be streamlined or automated to improve overall efficiency and reduce production time.
- Team productivity - Measure the productivity of individual team members and the team as a whole. This can include completed tasks per unit of time, meeting deadlines, and overall project throughput.
- Turnaround times - Track the time it takes to complete specific milestones or phases of a project. Analyzing turnaround times helps in setting realistic expectations for clients and stakeholders.
2. Generating data with a production tracker
You’ll need metadata from your digital creation tools to compute the aforementioned metrics.
Metadata is a rich source of information included in digital content creation and monitoring tools providing additional context and insights into various aspects of the production pipeline. The most efficient way to generate and query such metadata is to use a production tracker like Kitsu:
- Kitsu allows your studio to store your production data in a single place. You can synchronize your data across different digital creation tools and run custom scripts when events occur to automate most actions in your pipeline.
- The ability to collaborate remotely across the globe leads to better decisions and faster deliveries: you get information in real-time so you can assign tasks and send directives accordingly to make your team more productive. The data is stored securely and is always accessible to your team and pipeline so that everyone stays on the same page.
- We provide software integrations with popular tools like Blender, Unreal Engine, or Harmony, as well as developer tooling to facilitate cross-communication between your tools, allowing artists to stick to their favorite workflows.
You can start with Kitsu for free without the need for a consultant, intensive training, or technical know-how. All you need to start generating data is to start tracking your production assets and tasks using Kitsu, and Kitsu will take care of collecting everything.
3. Extracting data
There are two ways to extract data from Kitsu.
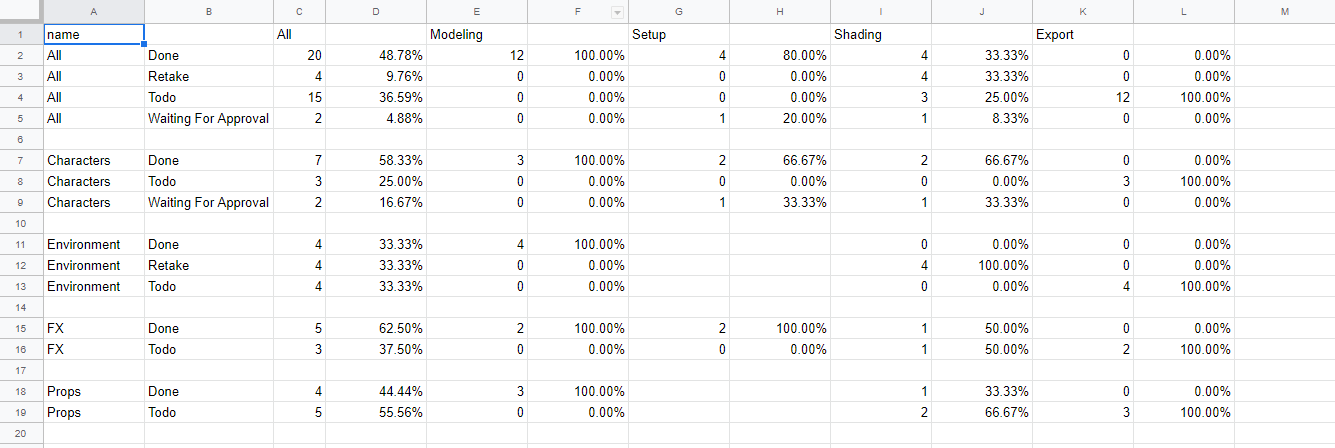
The first one is to go to a stats page and export the report as a .csv file. For example, with the asset stats page, you can quickly get an overview of the progress of your production:
Kitsu also exposes an HTTP API that allows you to centralize and access all your production data. This method is preferred for data analytics.
Building a movie involves a lot of data: assets, shots, casting, task assignments, file locations, etc. All this information is shared among all the departments. This data contains important metadata for analytical processes, for example:
Assets
- General Metadata - Includes creation dates, descriptions, and information about the artists or teams responsible for each asset.
- Versioning Information - Maintain metadata on different versions of a project or asset. Versioning information is crucial for tracking changes, understanding the evolution of a project, and ensuring that the latest versions are used in production.
- Historical Metadata - Retain historical metadata for assets and projects. This includes changes made, contributors involved, and any significant events during the production process. Historical metadata provides a comprehensive audit trail for analysis and learning from past experiences.
Tasks
- Production metadata - Capture metadata related to each production, like start and end dates, project type, genre, and associated clients or stakeholders. This information helps in categorizing and organizing projects for better management and reporting.
- Workflow Stage Metadata - Track the current stage of each task or asset in the production workflow. Understanding where each element is in the pipeline helps in managing timelines, identifying bottlenecks, and ensuring a smooth production process.
- Collaboration Metadata - Capture metadata related to collaboration like comments, annotations, reviews, and feedback from team members or clients. Collaboration metadata provides insights into communication patterns, issue resolution, and the overall collaboration dynamics within the team.
Extracting Kitsu data with the API
Kitsu’s REST API provides central storage for all your data that can be queried from anywhere using your favorite programming language:
For example, if you want to measure the turnover time for a given task, you can query the /actions/tasks/{task_id}/time-spents endpoint to get the time spent on a given task. You can then aggregate tasks over a given week to get a feel of the workload your team can accomplish in a week worth of sprints.
4. Data visualization
Kitsu already offers a wide range of charts, graphs, and tables for visualizing pipeline data by default without any extra action required:
- News feed to see all the task status changes minute by minute
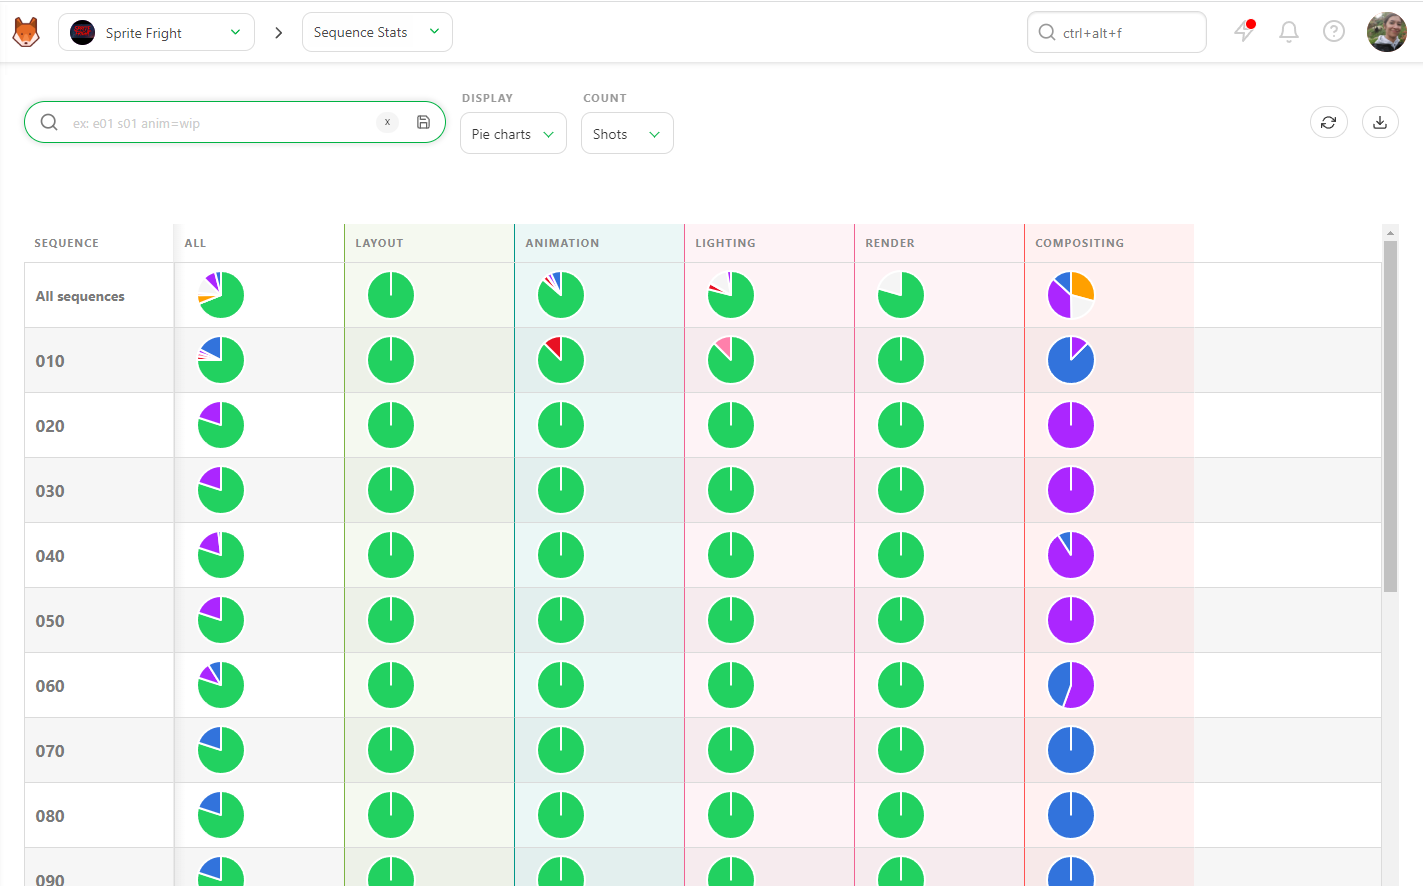
- Sequence stats with pie charts to know exactly the state of the whole production in a single page.
- Gantt charts and calendar views to visualize timelines.
- Daily quota to tell if your animators are productive or not.
- Casting management https://www.cg-wire.com/casting-management
However, there are several other options for data visualization when a view isn’t available.
A simple way to visualize data is to use spreadsheets like Google Sheets or Microsoft Excel. Just export your Kitsu data in CSV via the available export buttons or in JSON via the API and import this data in your spreadsheet.
You can then clean or transform the data before generating your own reports.
Feel free to contact us if you need help!
Conclusion
In conclusion, the integration of data analytics into animation studio management is a big paradigm shift in the industry: the data complexity of animation productions is transformed into strategic advantages, enabling studios to make informed decisions, streamline processes, and ultimately enhance their competitiveness.
By focusing on key metrics, animation studios can unlock the full potential of their data and pave the way for a more efficient and prosperous future. Production trackers like Kitsu are instrumental in becoming a data-driven studio. While the change can feel overwhelming, the jump is worth the deal. Having complete control over your data will propel your production to new heights.
Make sure to join us on Discord if you want to discuss the future of creative pipelines or just want to hang out with 1000+ animation experts from all over the world!


