Deploying a web server can be done quite easily. Especially, web applications like Kitsu where everything is documented online. An IT willing to spend several days on it will achieve it for sure. But the problem is that running a cloud application is not about setting the web service, it's about managing the unexpected.
I can say that confidently because when I built my first startup (Cozy Cloud), in the beginning, I managed our servers. I set up dozens of virtual machines, configured DNS, and was able to serve our product to our subscribed users. Everything sounded good until users really used our product.
Once I had my beautiful infrastructure up, I had to deal with tons of cumbersome situations: software failure, hosting provider outage, slowness, backup strategy, recovery... It happened at any time of the day or the night. I was co-founder and CTO, so I had tons of more duties to deal with. I learned a lot but let's be honest, it was not enough to handle the load. Fortunately, we raised funds and I was able to hire someone with experience to manage it for us. I could have looked for many other solutions. But in the end, admitting it was a full-time job was my best decision to deal with this situation.
That's why with CGWire, we want to avoid all that painful moments for studios. We know that our software is free, but it would not be wise to develop Kitsu without offering you a hosting service on top of it. Your main job is to make movies and your ITs are dedicated to your artists. They don't need to deal with web hosting complexity and its hazardous behavior on top of the hardware and the service they manage for your studios.
Kitsu is a key component of your pipeline. A failure from it could put your production at risk. It's additional stress that you don't want for yourself and your teams.
Many people are aware of this problem. That's why providing a cloud solution of the software is a classic business model for free and open-source projects, it's not specific to us.
To illustrate the job required to host properly such software, we wanted to show you all the things we set up on our infrastructure to serve you Kitsu properly. Today we manage the Kitsu installation for 60 customers for approximately an overall 3 000 users.
In this blog post, we will show you everything our ops team put in place to ensure you the best service possible for your usage of Kitsu.
Context
The base Stack
As a reminder, Kitsu is a web application made of:
- Two Python Flask services (REST API and a WebSocket pub/sub system)
- An RQ daemon
- A Redis instance
- A Postgres database.
- Files are stored on the disk or in an object storage instance.
- A frontend is made of static Javascript files built by the Vue.js framework tooling (based on Webpack).
- An Nginx instance to serve static files and as a reverse proxy to allow access to the API and the frontend from a single domain name.
To sum up it's made of seven services that should always be up. If one of them is down, the application cannot work properly.
The offer
We propose two offers to our clients:
- Cloud hosting where we put a dedicated VM at their disposal. All the services run in our cloud.
- On-premise installations where our clients provide the hardware. We do the setup, the maintenance, and the updates. We handle LDAP integration on request.
For bigger customers, we propose a tool to allow them to start and stop instances of Kitsu locally.
Orchestration
We use OVH as the hosting provider and OpenStack as IaaS (Infrastructure as a Service). Our infrastructure is based on virtual machines. Through Terraform we describe our hardware needs. It allows us to set up quickly new Kitsu instances.
You have here an example of a Terraform file used to spawn a new Kitsu:
module "customer_cgwire" {
  source         = "./modules/customer"
  shortname      = "cgwire"
  fqdn           = "cgwire"
  customer_class = "bronze"
  flavor         = "${var.flavor_bronze}"
  net_public     = "${var.net_public}"
  net_priv       = "${var.net_priv}"
  region         = "${var.region}"
  image_name     = "${var.image_name}"
  key_pair       = "${openstack_compute_keypair_v2.keypair.name}"
}
Terraform provides a simple command (terraform apply) to transcript our configuration files to a live infrastructure.
When the Kitsu VM is up, the next step is to configure the instance. We create the database, configure the operating system, and initialize the data. For this, we use a configuration management system. We used Ansible for a while but recently we moved to Saltstack. It felt more convenient to run many updates in parallel.
To use it, we describe configuration files and everything that should be up to have a proper Kitsu instance. Then we run the salt state.highstate command. Once finished, the Kitsu instance is ready to use!
Saltstack files example (here to set up a Redis service):
====== redis.sls
redis_packages:
  pkg.latest:
    - pkgs:
      - redis-server

/etc/redis/redis.conf:
  file.managed:
    - user: redis
    - group: redis
    - mode: '0640'
    - template: jinja
    - source: salt://{{ slspath }}/files/redis.conf.j2
    - context:
      bind_addrs: {{ redis['bind_addrs'] | join(' ') }}
    - require:
      - pkg: redis_packages

redis:
  service.running:
    - name: redis-server
    - enable: True
    - require:
      - pkg: redis_packages
    - watch:
      - file: /etc/redis/redis.conf

====== redis.j2
daemonize yes
pidfile /var/run/redis/redis-server.pid
port 6379
bind {{ bind_addrs }}
Storage
Kitsu stores tons of preview files. They are mainly video files. Every time a user uploads a video, it is normalized and some thumbnails are extracted. Because studios want to have access to a high def version of videos, the files stored are quite big.
Pictures generate thumbnails too and other file types are stored directly.
So, how do we store these files? It depends on the context, we have two cases:
- On-premise installations: We mainly store previews on a simple file system (a folder available on the host on which we host the Kitsu instance). Kitsu organizes folders based on preview file UUIDs (generated by Postgres) to avoid having too many files in the same repository and ensure there is no collision. Alternatively, we propose local object storage too for enterprise customers.
- Cloud hosting: we use OpenStack Swift from OVH as object storage. In cloud infrastructure, you can lose a virtual machine easily. That leads to losing all your file data. Using dedicated storage decoupled the files from the VM. So, it makes things easier for backup (we replicate every file 3 times in 2 different locations). It allows us to destroy and restore Kitsu VMs easily.
Compute
Another thing we need to manage is video computing. It's important to normalize every video uploaded to ensure a smooth experience while playing them. To achieve that, we use FFmpeg. It handles all codecs and containers we can have as inputs. On the other side, as outputs, it serves standardized and optimized movies for our system.
The drawback is that it leads to very intensive resource consumption. So to avoid overloading our VMs, we set up a Nomad cluster from the Hashicorp company. We push to it all the computing-heavy async jobs from the Kitsu instances. Kitsu creates a Nomad job, that starts a Docker container, takes the video, computes them, and uploads all files on object storage. Then it clears everything locally to be able to handle the next videos.
Nomad can manage a cluster of VMs and provides a single entry point for anything that needs to use the cluster. It makes our video normalization much more efficient. We use it too for playlist builds: our users concatenate several shot versions together to build a single movie. This action is the most resource-intensive by far.
Logs
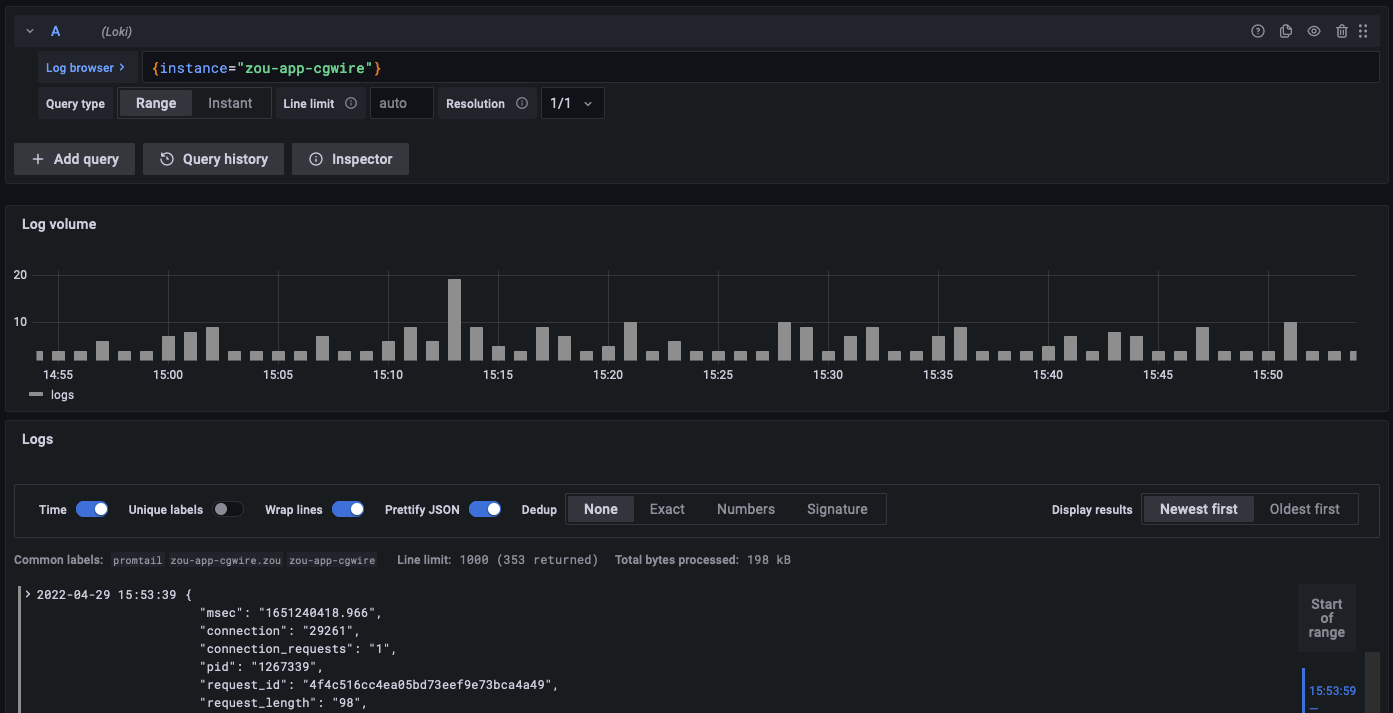
In all instances, standards logs are written on each host. It's complicated to access them all to find bugs or to analyze situations. That's why we use Grafana Loki as a log aggregation system.
It grabs all log information and allows us to search error occurrences across instances. From there we can monitor performance bottlenecks too. Last but not least it gives an idea of where come from requests. Which can be useful in case of a cyber attack.
Monitoring
A very important thing for a system administrator is monitoring. It alerts you when a problem pops up on your infrastructure. It matters a lot because:
- We are aware of problems before the customer calls us by saying "it’s broken!"
- It helps us to find the root cause of a problem quickly.
To make it more concrete, mainly we collect a bunch of conditions on a regular basis:
- Key services are up or not.
- The Kitsu instance is reachable via the internet or not.
- CPU load is above a threshold.
- Memory consumption is above a threshold.
- Free disk space is below a threshold.
If one of the conditions is not fulfilled, it raises an alert. If an alert occurs, we know that we must do something to fix the situation right now.
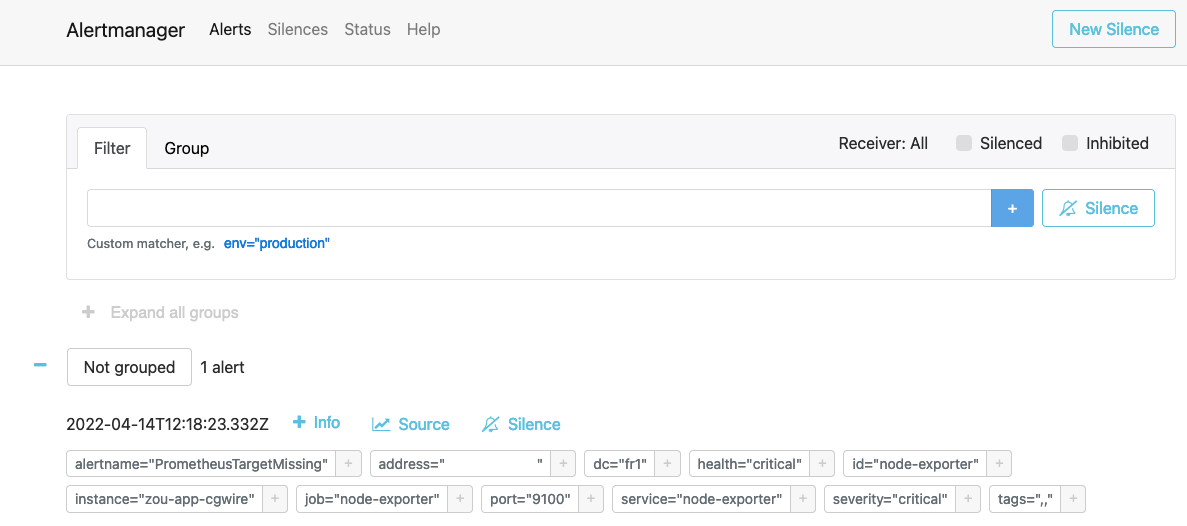
For the cloud stack, we set the monitoring with the Grafana products: Prometheus and Alertmanager. We send alert messages to a dedicated Slack channel and the most important ones are sent via emails too.
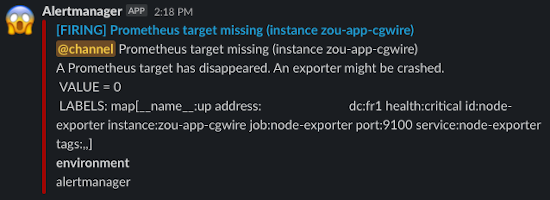
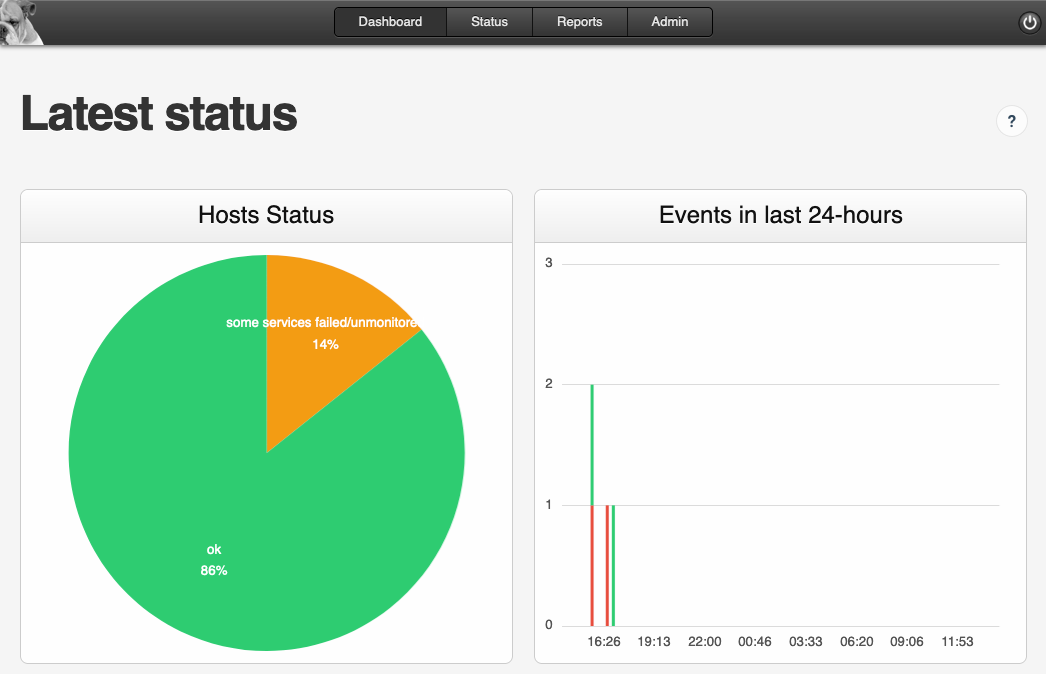
The Alertmanager dashboard shows all alerts in progress in real-time:
We collect metrics on system hosts and we ping HTTP ports to have a full specter of information.
For our on-premises installation, due to legacy and simplicity reasons, we use the couple Monit and M/Monit to have a centralized view of the state of our installations.
Metrology
It’s the other side of monitoring. Here we analyze data visually. We don't look for whether the instance is up or not. But we look for weird behaviors (unexpected changes over time), like prolonged usage of a CPU (in that case, the system is still up but the service is degraded).
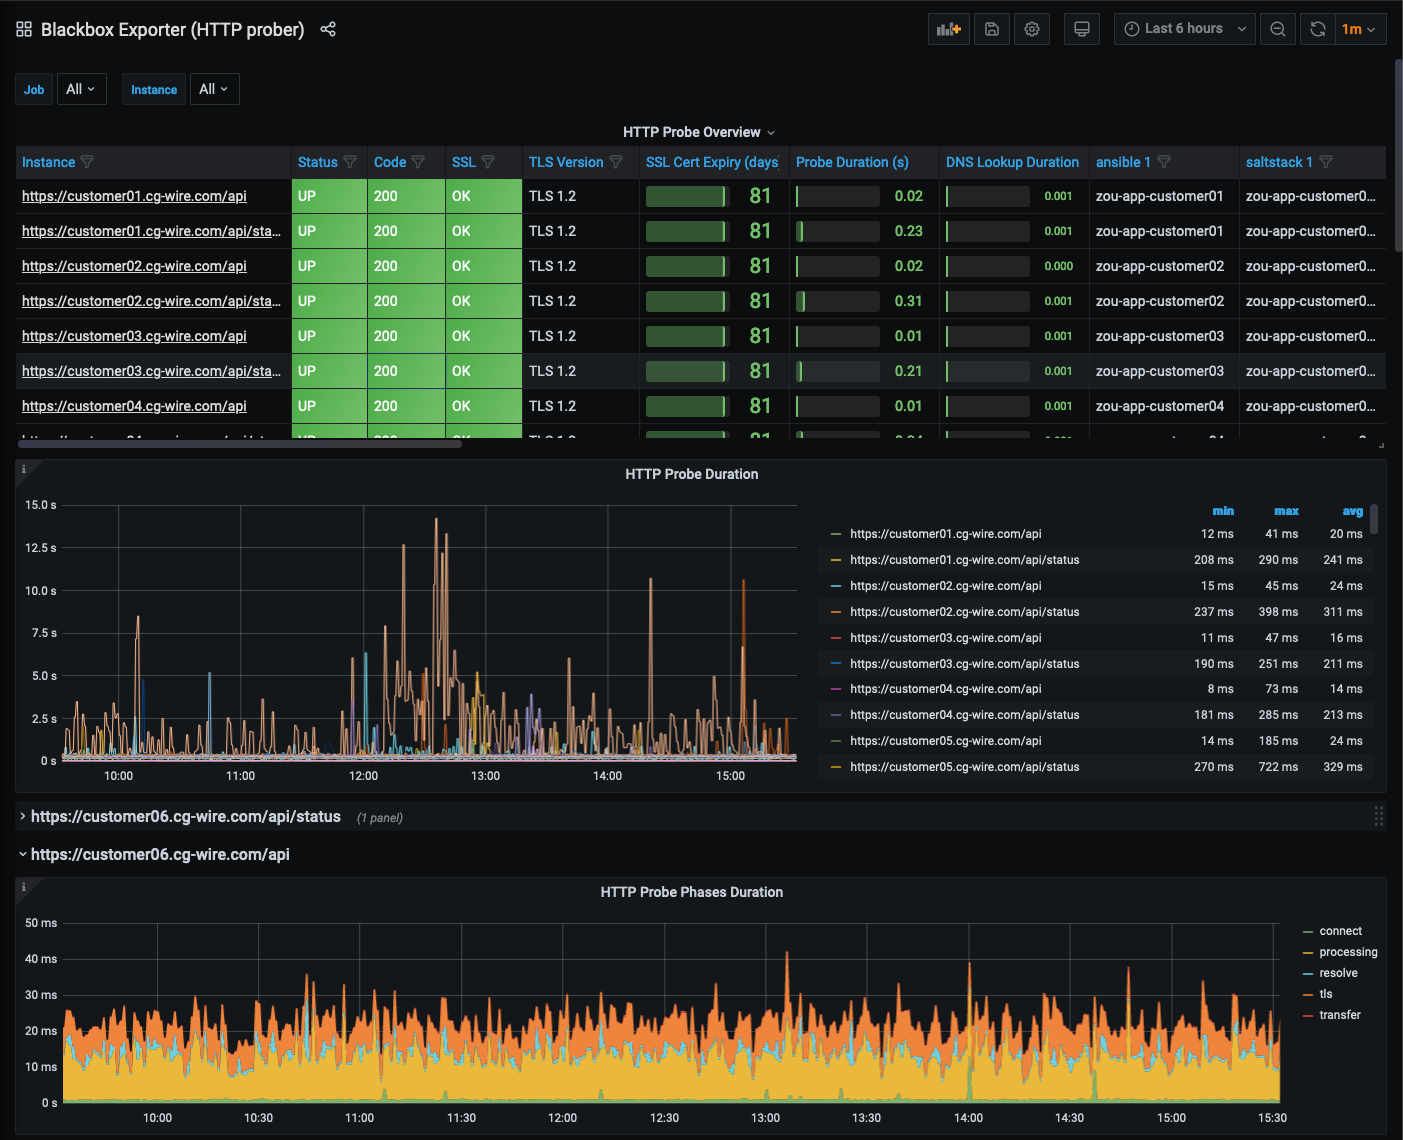
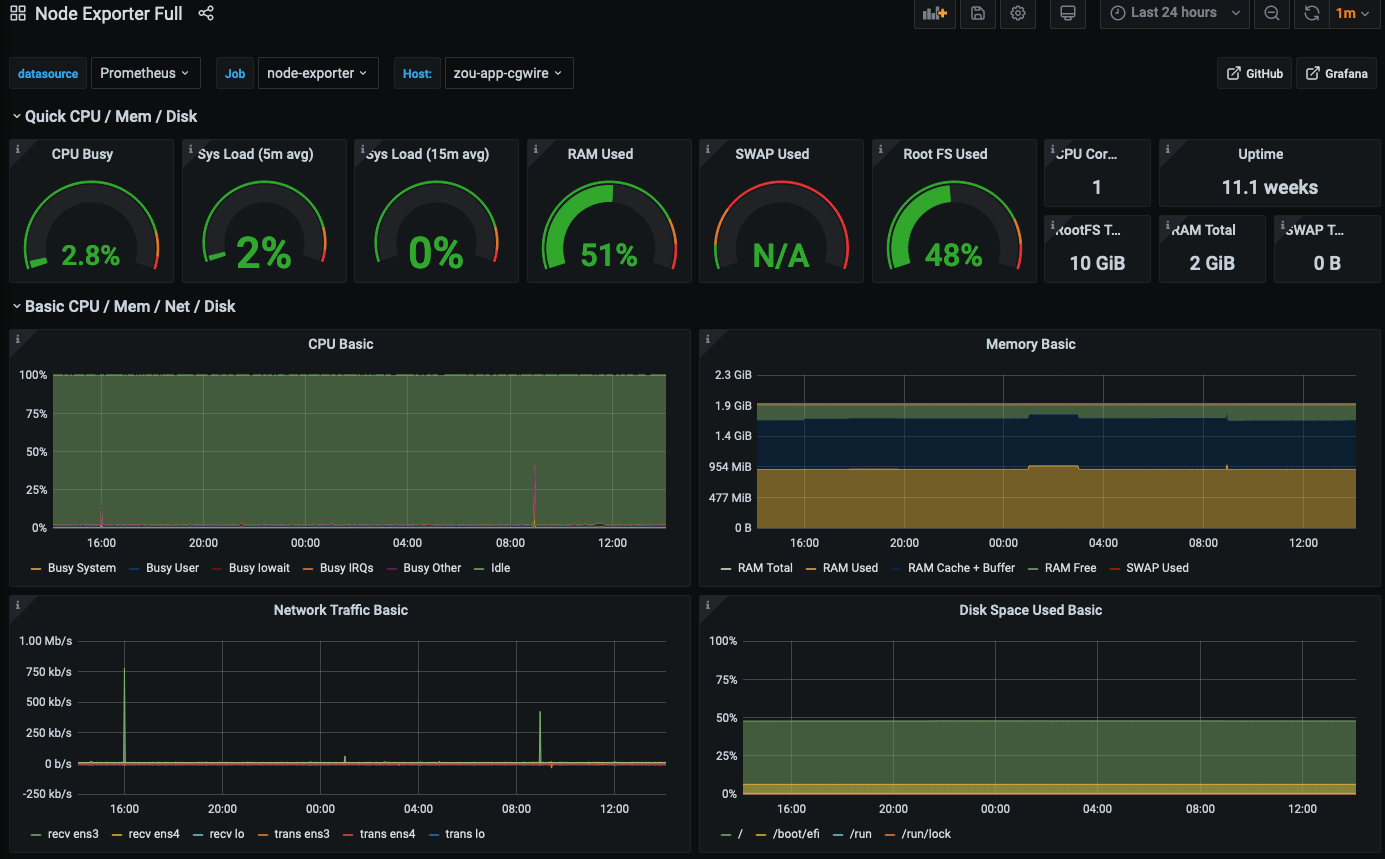
We use the same tools to collect metrics for metrology. The central component is Prometheus to store the data. It is coupled with Grafana for the display. It provides a powerful system to see metrics evolve over time. When your file system has a problem, you can see if it happened in a second, day, or minute. You can identify recurring patterns too. It’s very helpful to find the root cause of your problem.
Here are a few examples:
Check the "HTTP health" of an instance:
See how resource consumption evolves:
Security
Security is the most important part of the setup. To strengthen our machines we applied fundamental principles:
- The only way to connect to a host is SSH via an SSH key protected by a passphrase. This reduces the risk of unneeded connection with password brute force.
- Some virtual machines don’t need to be accessed from the internet. So we use SSH relays to manage them. It reduces the attack surface.
- We whitelist IP addresses to access our critical machines that still need to be accessed from the internet.
- For on-premises, we use VPNs to connect with studios that have important security measures.
- We have security groups that authorize only TCP ports used by our customers.
- We set up firewalls and IP ban schemes on all machines.
- All Kitsu instances use a strong SSL configuration to manage user connections.
- Our instance OS is always up to date.
- Our logs are collected and analyzed via SIEM protection.
The next step for us will be to encrypt the files in the object storage to limit problems if the object storage is compromised.
Recovery
Another very important thing is backup and recovery. With previews in object storage, duplicated Postgres database, and database backup in the object storage, we have everything at hand to respawn a Kitsu instance quickly.
If a customer instance burns, we re-create it from Terraform, and configure it with Saltstack. And voilà it's up! The instance can still access the object storage, set up the database again, and serve files as usual.
If the object storage fails, we can connect to the replicated object storage and start using our software like before. We simply have to update our configuration files through Saltstack.
Miscellaneous
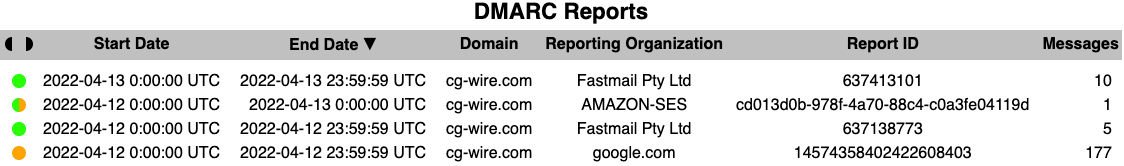
We send emails to our users from our own domain name. To improve deliverability, we configured all our systems with SPF and DKIM. These protocols allow tracking of all emails sent with cg-wire.com as a domain name.
To monitor that, we configure the DMARC protocol. With this, each server that relays @cg-wire.com email sends a daily report which helps to identify the email sources. We know too if they use properly SPF and DKIM, and when our emails are considered spam. It allows us too to build dashboards to track analytics about our emails and to find why they were improperly labeled. In the end, we keep a good reputation for our email domain name.
Final Words
That's it for the tour! We only showed you the tip of the iceberg. There are many subtleties and details we cannot give there (it would require writing a book). Nevertheless, it gives you an overview of the work required to run any web application like Kitsu. What we craft at CGWire is not only beautiful and efficient software. We dedicate the same care to your installation and your data. We always work on it as something we want to be proud to show and that works seamlessly for you.
Studio Collaboration requires software that runs properly, is safe and that can handle heavy loads. People need to trust a tool to use it. This is our job to make it solid, efficient, and secure.
Our next challenge will be the region management for our cloud infrastructure. We have more and more customers that are far away from France. We want to give the best performance possible by providing Kitsu instances near their studio. Once we solved that problem, we'll share our recipe. So, stay tuned to know how we did it!
We dedicated this blog to Animation Production Management, Animation Pipeline, and to our products. But you can follow us on LinkedIn to see our news. We also share news from the animation industry. Come take a look and join us!