How many hours do you spend each week pulling data and generating reports?
Animator studios use Kitsu to track progress, yet we still see supervisors spend hours manually compiling that data into PDFs just to keep producers and directors in the loop. It's a massive drain on creative energy and a manual point of failure that a senior team shouldn't have to deal with. If the data already exists in our tracking software, sharing it shouldn't be a struggle.
As a technical lead, your job is to automate mundane tasks so the artists can focus on the art. And by using the Gazu Python client, we can bridge the gap between Kitsu's database and the final stakeholder report.
Today, we're going to build a script that programmatically pulls project metrics and generates a custom PDF, turning a 2-hour manual chore into a five-second automated task.
Why Custom Reports?
Kitsu is a lifesaver for keeping the chaos of a production organized. The built-in dashboard covers all use cases, even multi-production analysis. But sometimes, "standard" doesn't cut it.
For example, clients might want to feel like they're paying for a premium service. Sending them a raw software screenshot or a generic link feels a bit amateur. By using custom reports, you can deliver progress updates wrapped in your studio's branding, ensuring the presentation looks as polished as the frames you're delivering.
Then there is the struggle of finding a producer-friendly format. A producer asks for a very specific Excel pivot table or a legacy PDF for the archives that follows a bizarre internal logic only they understand. If you need to export a filtered list of every shot in Sequence 02 that's currently "In Progress" but stuck with "Overdue" retakes, a custom report gets you that data instantly. It saves you from the manual copy-pasting nightmare and lets you get back to animating.
Some studios also need custom views for advanced tracking. Custom data can help you spot department bottlenecks, like when the lighting team is consistently stalled because the FX cache is lagging, allowing you to solve the friction before it turns into a Friday night crunch.
Fortunately, Kitsu is extremely easy to build upon.
You can find the complete source code for the example integration showcased in this guide on our GitHub:
🔗 https://github.com/cgwire/blog-tutorials/tree/main/custom-kitsu-reports
1. Kitsu Setup & Authentication
First, you need to talk to your Kitsu instance.
If you don't have a studio URL yet and want to run Kitsu on your own machine, Docker is the fastest way to get a production-ready environment up and running:
docker run --init -ti --rm -p 80:80 -p 1080:1080 --name cgwire cgwire/cgwire
For scripting, we will use the official Kitsu Python SDK, gazu.
You can authenticate using your user credentials, which is fine for local testing:
import gazu

gazu.set_host("http://localhost/api")
user = gazu.log_in("admin@example.com", "mysecretpassword")
2. Fetch Production Data
Before we write a single line of code, we need to talk about the data Kitsu exposes. If it exists in the UI, you can probably grab it via Gazu.
The API is surprisingly deep. For a solid production report, you could typically be pulling:
- Progress Metrics: Status changes (e.g., moving from "WIP" to "Internal Review" using events).
- Time Tracking: How long a shot has been "In Progress" versus the original estimate.
- Cast Lists: Every Character, Environment, and Prop associated with a specific Episode or Sequence.
- Workload: The exact number of frames or assets currently assigned to a specific artist.
- Budget: How the team quota evolves over time.
- And many more resources you can read about in our detailed developer documentation.
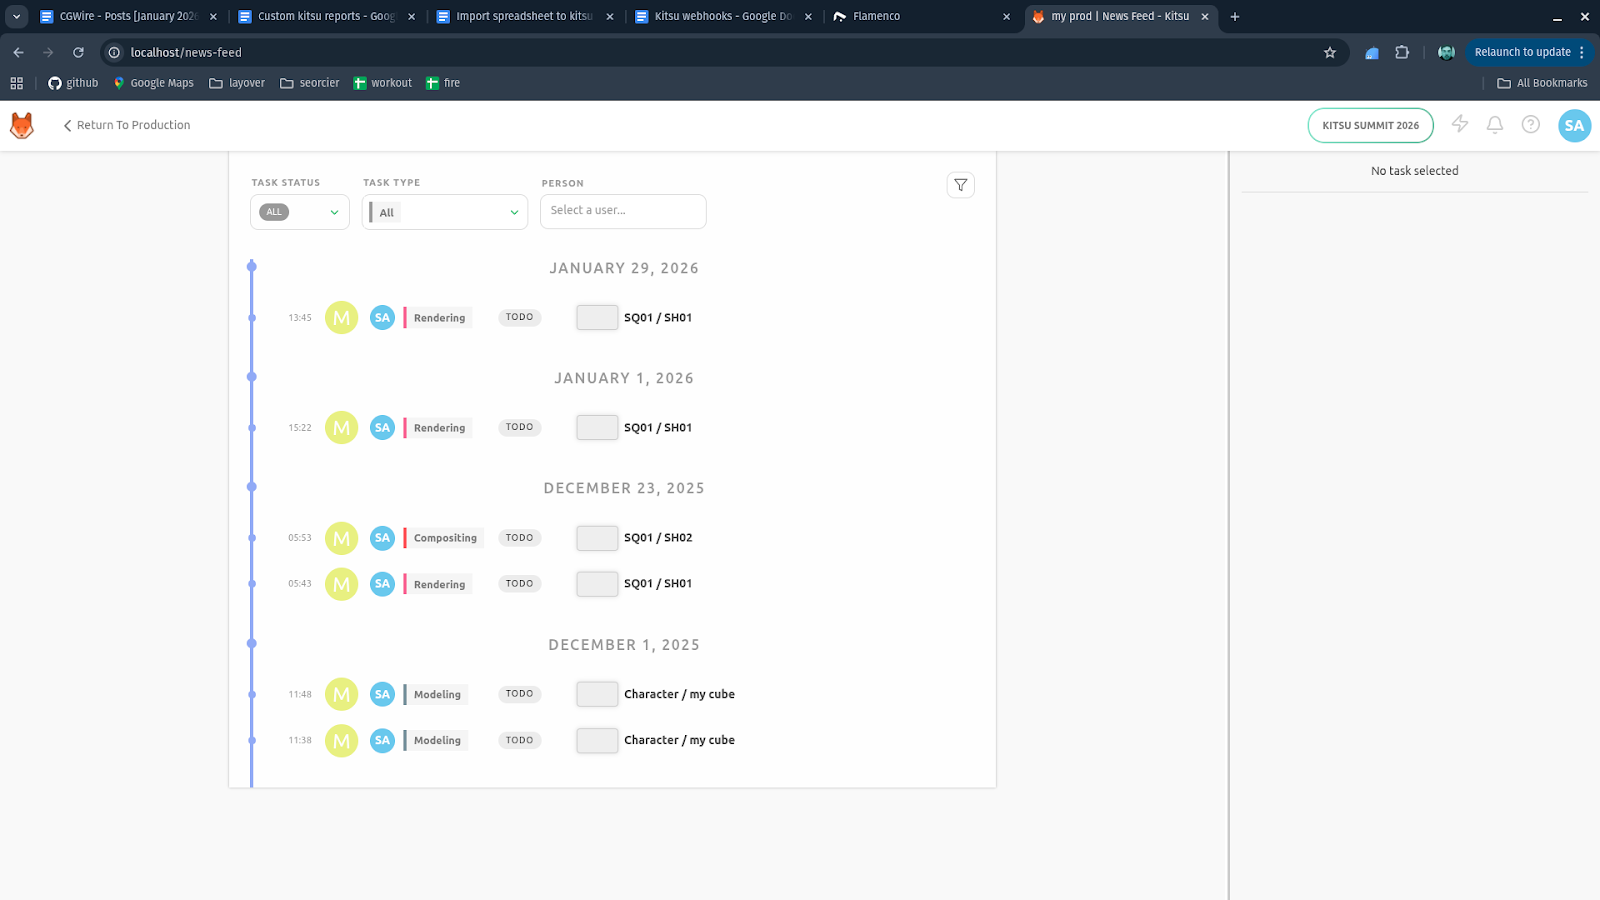
Let's look at a common scenario: you need a quick rundown of every task currently assigned to your team members for a specific project. This is the foundation of any "Who is doing what?" report.
projects = gazu.project.all_projects()
project = projects[0]

tasks = gazu.task.all_tasks_for_project(project)

report = []

for task in tasks:
    assignees = [gazu.person.get_person(p_id)["full_name"] for p_id in task["assignees"]]

    task_info = {
        "date": task["updated_at"],
        "entity": gazu.entity.get_entity(task["entity_id"])["name"],
        "type": gazu.task.get_task_type(task["task_type_id"])["name"],
        "status": gazu.task.get_task_status(task["task_status_id"])["name"]
    }

    for artist in assignees:
        report.append({**task_info, "artist": artist})
Gazu returns dictionaries. When you're fetching all_tasks_for_project, keep in mind that on a feature-length production, this can be a massive amount of data. Always try to filter your data. For example, by task_status or entity_type, if you only need to see, say, active Animation shots.
3. Creating a Reusable Template
Now you need to decide how to render the PDF. There are two main options here.
You can use ReportLab. This is the barebones method. It is fast and requires no external non-Python dependencies. Best for internal tech reports, simple line-item tables, and high-speed batch automation.
Or you can create an HTML to PDF rendering pipeline using Jinja2 (templating) and WeasyPrint. This is often the preferred method because you can use CSS to style the report. If you can make a webpage, you can make a report. It's best for client-facing deliverables, heavy branding, and complex layouts.
Let's define your configuration and template:
STUDIO_NAME = "My Animation Studio"
STUDIO_LOGO = "studio_logo.png"  # local file path
PROJECT_NAME = "My Project"
OUTPUT_PDF = "activity_report.pdf"
You use Jinja2 syntax ({{ variable }}) to inject your Python data into standard HTML.
<!doctype html>
<html>
    <head>
        <meta charset="utf-8" />
        <style>
            body {
                font-family: Arial, sans-serif;
                margin: 40px;
            }
            header {
                display: flex;
                align-items: center;
                margin-bottom: 30px;
            }
            header img {
                height: 50px;
                margin-right: 20px;
            }
            h1 {
                color: #2a2a2a;
            }
            table {
                width: 100%;
                border-collapse: collapse;
                margin-top: 20px;
            }
            th {
                background: #222;
                color: white;
                padding: 8px;
                text-align: left;
            }
            td {
                padding: 8px;
                border-bottom: 1px solid #ccc;
            }
            .footer {
                margin-top: 40px;
                font-size: 10px;
                color: #777;
                text-align: center;
            }
        </style>
    </head>

    <body>
        <header>
            <img src="{{ studio_logo }}" />
            <h1>{{ studio_name }} – Activity Report</h1>
        </header>

        <p>
            <strong>Project:</strong> {{ project_name }}<br />
            <strong>Report Date:</strong> {{ report_date }}
        </p>

        <table>
            <tr>
                <th>Date</th>
                <th>Artist</th>
                <th>Task</th>
                <th>Entity</th>
                <th>Status</th>
            </tr>
            {% for row in rows %}
            <tr>
                <td>{{ row.date }}</td>
                <td>{{ row.artist }}</td>
                <td>{{ row.entity }}</td>
                <td>{{ row.type }}</td>
                <td>{{ row.status }}</td>
            </tr>
            {% endfor %}
        </table>

        <div class="footer">Generated automatically by {{ studio_name }}</div>
    </body>
</html>
This HTML file acts as a Jinja2 template that defines the visual structure and styling of the report, including page layout, fonts, colors, and a table for displaying activity data. The {{ ... }} expressions mark placeholders for values such as the studio name, logo URL, project name, and report date, while the embedded CSS ensures the document looks polished and print-ready when rendered or converted to PDF.
When the Python code renders this template, Jinja2 replaces all placeholders with the actual values passed in from the script and executes the {% for row in rows %} loop to generate one table row per activity record. Each row dictionary supplies the date, artist, task, entity, status, and hours values, with the hours field explicitly formatted to two decimal places, producing a complete HTML document with a fully populated table.
The rendered HTML is given to WeasyPrint, which interprets both the HTML structure and the inline CSS to lay out the content as a printable document. The studio logo is loaded via its URL or relative path, the table and text are styled exactly as defined in the template, and everything is rendered into a PDF file that visually matches the HTML design, ending with the footer that confirms the report was generated automatically.
4. Rendering
Finally, you glue it all together. You use jinja2 to fill in the placeholders in the HTML with your data, and then WeasyPrint converts that HTML string into a PDF file:
from jinja2 import Environment, FileSystemLoader
from weasyprint import HTML
from datetime import date

env = Environment(loader=FileSystemLoader("."))
template = env.get_template("report.html")

html = template.render(
    studio_name=STUDIO_NAME,
    studio_logo=STUDIO_LOGO,
    project_name=PROJECT_NAME,
    report_date=date.today().isoformat(),
    rows=report,
)

HTML(string=html, base_url=".").write_pdf(OUTPUT_PDF)

print(f"PDF generated: {OUTPUT_PDF}")
The first part of the code sets up Jinja2 to load an HTML template from the current directory and then retrieves the aforementioned report.html.
Next, the template is rendered into a complete HTML document by injecting runtime data into those placeholders. Studio and project metadata are passed in, and the current date is generated in ISO format. The result of this step is a plain HTML string with all dynamic values resolved.
Finally, the rendered HTML is handed to WeasyPrint, which parses the HTML and any associated CSS and assets, then converts it into a PDF file. The base_url parameter ensures relative paths to images or stylesheets work correctly, and the finished PDF is written to the output path before printing a confirmation message.
We obtain this final result:
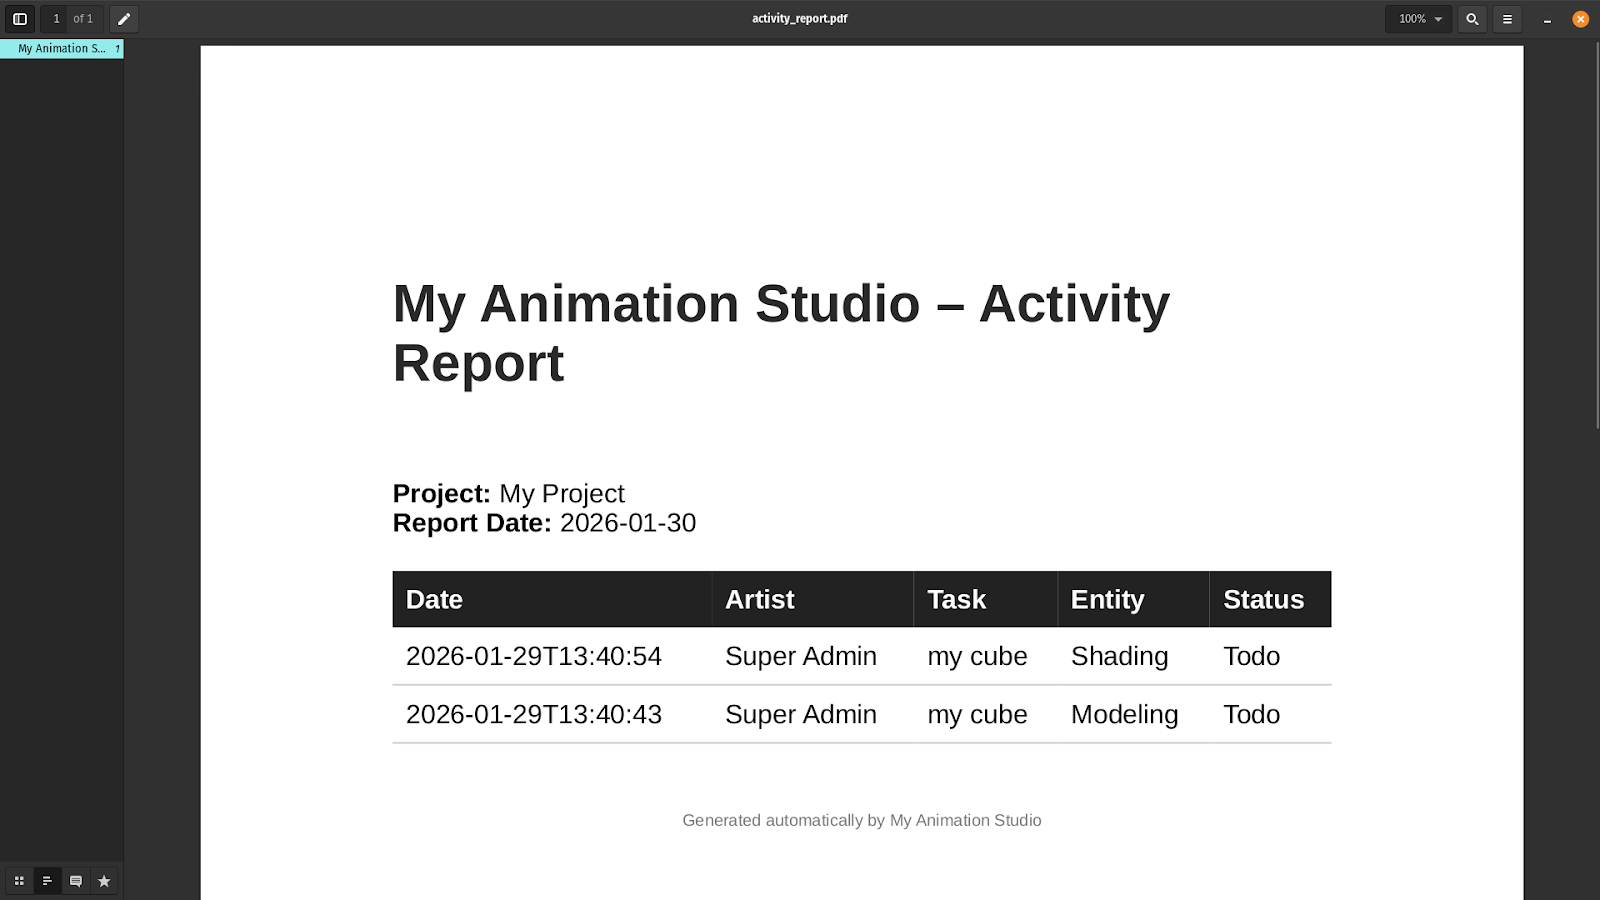
You can try running the script yourself in a minute by cloning our corresponding Github repository.
5. Automation Tips
Automation is where this workflow actually pays off the biggest dividends: once your report script works locally, the next step is making sure it runs reliably without human intervention, and that the output ends up where people already look.
Instead of manually running the script, set up a cron job on your server to execute it at a predictable time. For example, running the script every weekday at 6:00 PM ensures the PDF is generated overnight and ready when producers start their day. This is especially useful for daily burn-downs or shot status summaries.
Once the PDF is generated, use gazu to attach it directly to a relevant entity in Kitsu, like a Production, Episode, or a recurring Task. This turns your report into a first-class production artifact with a permanent history. For example, uploading each day's report to a "Daily Production Report" task makes it easy to audit changes over time or reference past decisions. A practical tip: include the date in both the filename and the attachment comment so reports are easy to scan in the Kitsu UI without downloading each one.
To push the report directly to stakeholders, use Python's built-in smtplib (or a transactional email service) to send the PDF as an attachment. This is ideal for producers or clients who don't live in Kitsu all day. A concrete pattern is to email a short summary in the body—"Shots blocked: 12, shots finaled: 3"—and attach the full PDF for details.
Instead of hardcoding a single HTML layout, store multiple Jinja2 templates like client_report.html and internal_audit.html to generate different report styles from the same Kitsu data. For example, clean, high-level summaries for clients and more detailed tables for internal tracking. A useful approach is to share base templates and macros (headers, tables, status badges) so changes to branding or layout propagate across all report types. Version these templates alongside your code so you can reproduce older reports exactly if needed.
Conclusion
The bigger idea here isn't just about PDFs: it's about reclaiming time and attention for the work that actually moves a production forward!
By pulling structured data out of Kitsu with Gazu, shaping it with Python, and rendering it into polished, automated reports, you replace a fragile, manual ritual with a repeatable system that runs quietly in the background. What used to be hours of copy-pasting, formatting, and double-checking becomes a dependable pipeline: accurate data, delivered on time, in a format producers and clients actually want to read. Custom reports let you communicate progress with confidence, surface problems before they become crunch, and present your studio as both creatively sharp and technically disciplined.
The more complex your pipeline is, the more important it becomes to create custom reports, so make sure to read more of our scripting guides for inspiration!